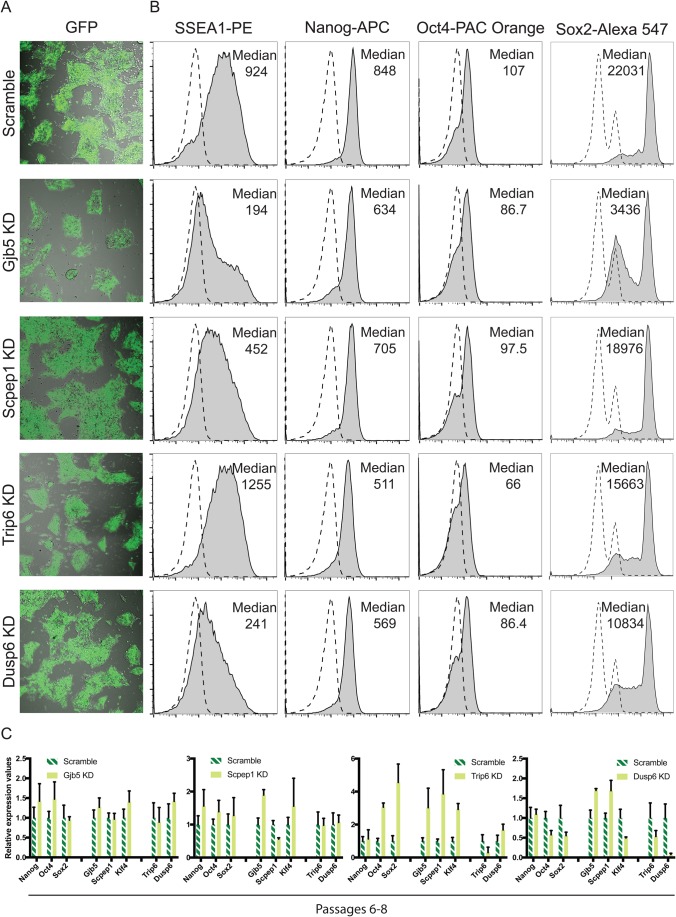
Fig. 7.
Pluripotency stability is affected after knocking down some newly identified conserved genes. (A) Confocal micrographs of mESCs 72 h after transduction showing the levels of GFP+ transduced cells. These are representative results of three biological replicates. (B) Flow cytometry plots showing the levels of pluripotency gene expression in KD mESCs. Median is highlighted for the sample analysed and the respective IgG control is presented in a dashed line. These are representative results of three biological replicates. (C) RT-qPCR showing the expression levels of core pluripotency genes and newly discovered pluripotency-associated genes in knockdown and control scramble transduced mESCs after six to eight passages in 3 μg puromycin. Expression values are normalised against Gapdh. Three independent biological replicates were analysed. Error bars represent the standard deviation.

