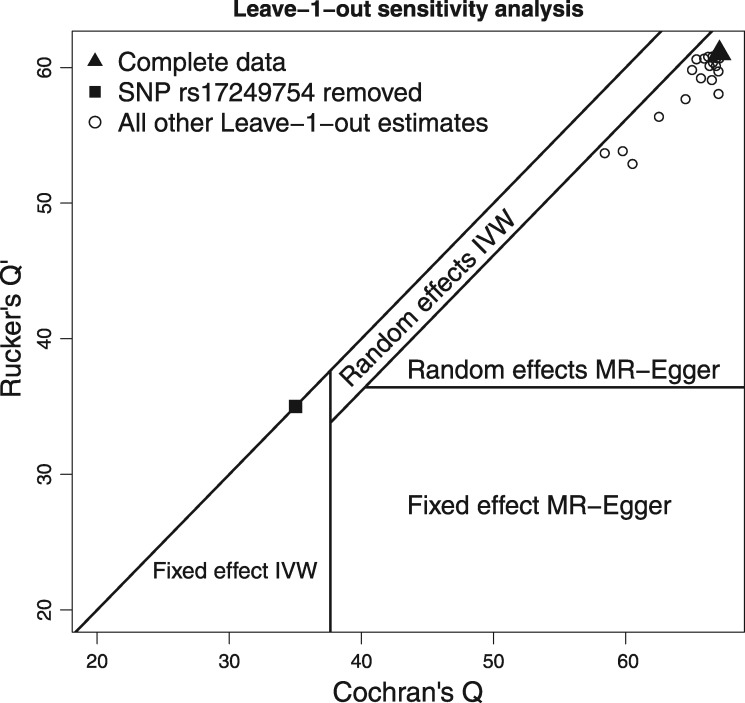
Figure 5.
Leave-one-out sensitivity analysis of the data, showing the values of Q and when each variant is left out of the analysis in turn. Points are overlaid on the Rücker decision space that governs which of four model choices should be favoured. It assumes a significance threshold of δ = 0.05 to affect the model selection.

