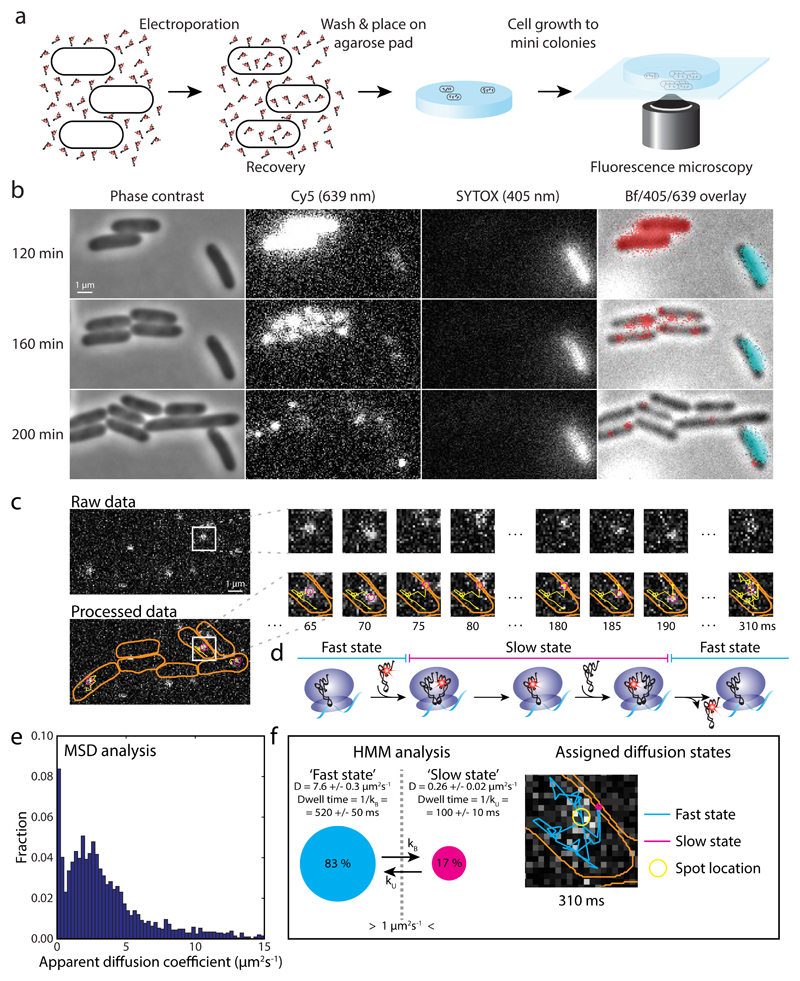
Figure 1. Tracking of single [Cy5]tRNAPhe in live E. coli cells.
a E. coli cells were electroporated with Phe-[Cy5]tRNAPhe, recovered in RDM medium, washed, placed in dilute culture on an RDM-agarose pad, and allowed to grow to mini colonies prior to data acquisition. b Phase contrast, fluorescence, and bright field (Bf) imaging of cells after electroporation with Phe-[Cy5]tRNAPhe. [Cy5]tRNAPhe appear as bright pixels in Cy5 lane, and red pixels in overlay lane. SYTOX stained, i.e. dead cells (bright pixels in SYTOX lane, and cyan pixels in overlay lane), were omitted in the analysis. Live cells continued growing after laser exposure during data acquisition (Supplementary Fig. 2). c Time series of tRNA tracking at 5 ms per frame, showing cell outlines (orange), present location of the particle (magenta), and the particle trajectory over time (yellow). This example shows an apparent binding of approximately 100 ms. d Predicted diffusion of [Cy5]tRNAPhe molecules being utilized on ribosomes. e Histogram of apparent diffusion coefficients for [Cy5]tRNAPhe in live E. coli cells, estimated from MSD analysis of trajectories such as in panel c. f HMM estimated diffusion of [Cy5]tRNAPhe in live E. coli cells, coarse-grained from a six-state model (Supplementary Table 1) into two states, ‘slow’ and ‘fast’, with a threshold of 1 µm2/s separating them. The right part shows the trajectory in panel c, now color coded with respect to diffusional state. 17,286 total time steps (n = 17,286) were included in the analyses in panel e and f.

