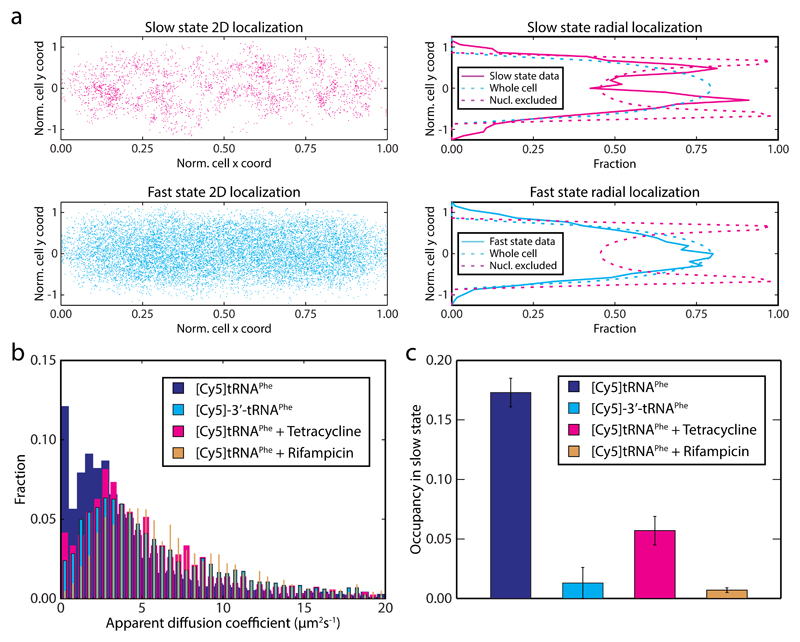
Figure 2. Internalized [Cy5]tRNAPhe take active part in translation.
a Spatial distribution of [Cy5]tRNAPhe in DH5α cells belonging to the slow or the fast diffusive state according to coarse-grained HMM analysis (n = 17,286). In the left panels, locations are plotted on normalized cell width and length coordinates. The right panels show the same data (excluding particles in cell poles and cell center, i.e. including particles within 0.2 < x < 0.4 or 0.6 < x < 0.8) projected on the short cell radial axis (solid lines). Dashed lines correspond to uniform distributions in the cytoplasm and nucleoid excluded regions respectively. b MSD-estimated apparent diffusion coefficients of 3’ inactivated tRNA, [Cy5]-3’-tRNAPhe (n = 11,231) in live E. coli cells, as well as normal [Cy5]tRNAPhe in mini colonies of E. coli cells treated with tetracycline (n = 10,415) or rifampicin (n = 12,042). Data for [Cy5]tRNAPhe in non-treated cells (Fig. 2b) is shown for comparison. c HMM estimated occupancy of the dye-labeled tRNAs in the slow diffusional state (see Supplementary Table 1). The trajectories used were the same as in panel b. Error bars represent bootstrap estimates of standard errors.

