
Figure 2.
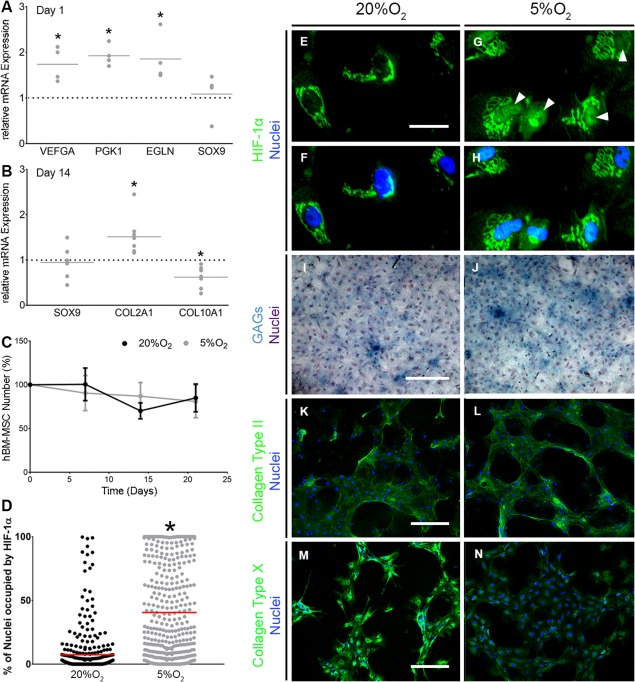
Hypoxia induces HIF‐1α nuclear localization and promotes an articular chondrocyte‐like phenotype. (A, B): gene expression of VEGFA, EGLN and PGK1, and SOX9 (n = 4) at day 1 (A) and SOX9, COL2A1, and COL10A1 (n = 8) at day 14 of chondrogenesis (B). Values plotted are fold change in response to 5%O2 compared with 20%O2, which is represented by the horizontal dotted line. The solid gray line represents the mean. *denotes p < .05 compared with 20%O2. (C): Human bone marrow‐derived mesenchymal stem cells number throughout chondrogenesis as determined by PicoGreen assay (n = 3). Values are normalized to cell number at day 0 and error bars show standard error of the mean. (D): Quantification of nuclear HIF‐1α immunofluorescence in (F–H) at day 1 of chondrogenesis (n = 3). Each value represents the percentage of a single nucleus that is occupied by HIF‐1α. The red horizontal line represents the mean with *p < .05 compared with 20%O2. (E–H) HIF‐1α immunofluorescent staining. Scale bar = 50 μm. Representative images of 3 independent repeats. Images were cropped and magnified to visualize localization of HIF‐1α. (I, J): Alcian blue staining for GAGs with hematoxylin counterstain at day 21 of chondrogenesis (n = 3). Scale bar = 400 μm. (K–N): Collagen Type II (K, L) and X (M, N) immunofluorescence staining at day 21 of chondrogenesis (n = 3). Scale bar = 400 μm. Brightness and contrast were adjusted to an equal degree between all conditions. Abbreviations: GAGs, glycosaminoglycans; HIF, hypoxia inducible factor.