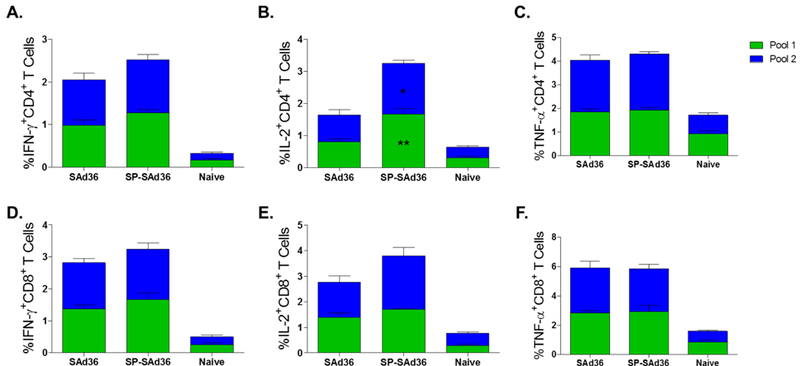
Figure 5.

Cytokine-secreting T cells after ex vivo stimulation with cPvMSP1 peptide pools 5 days after the final immunization and assessed by flow cytometry. A-C) Frequency of cytokine-secreting CD4+ T cells following stimulation with cPvMSP1 peptide pools 1 or 2. D-F) Frequency of cytokine-secreting CD8+ T cells following stimulation with cPvMSP1 peptide pools 1 or 2. Interferon-γ-secreting T cells are shown in Figures A and D. Interleukin-2-secreting T cells are shown in B and E. Tumor necrosis factor-α-secreting T cells are shown in C, and F. Values presented represent the percentage of either CD4+ or CD8+ T cells positive for the individual cytokine. Statistical analysis was conducted using Kruskal Wallis with Dunn’s post-test was used to determine differences in the production of cytokines in response to a stimulus with an individual peptide pool between mice immunized with a regimen that included priming with SAd36-cPvCSP/cPvMSP1 or priming with SP-SAd36-cPvCSP/cPvMSP1. Statistically significant differences between the SAd36 and SP-SAd36 regimens in response to individual pools are denoted by *(p < 0.05) and **(p < 0.01) within the SP-SAd36 bar.
