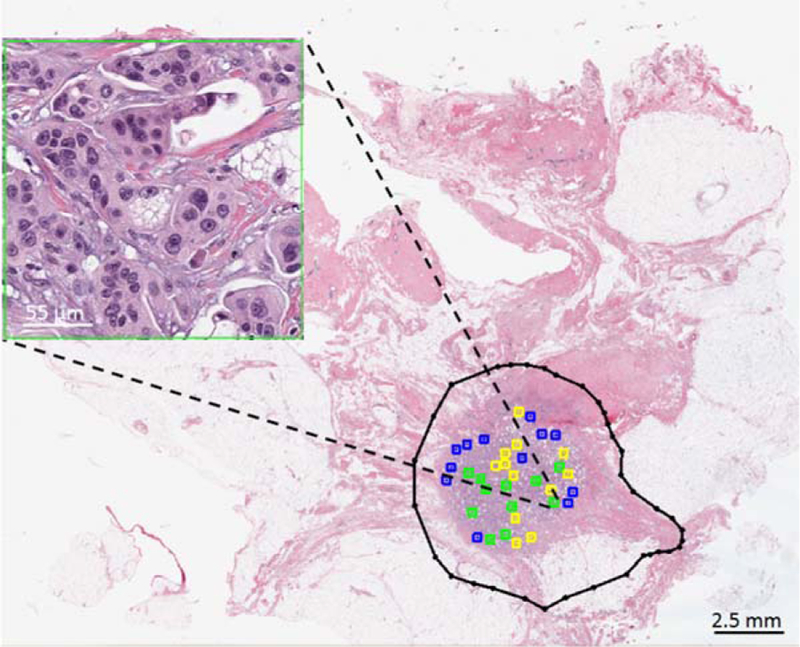
Figure 2.

Subset of cellularity assessment dataset from image patches annotated by expert pathologist. 512×512 pixels patches were selected by the pathologist from within the tumor bed (black contour) and were given a score to depict the cellularity of the malignant components within the given patch. Four categories of patches were chosen by the pathologist: 0% (pink), 1–30% (blue), 31–70% (yellow), and 71–100% (green). The image patch shown in this figure was scored as 80% by pathologist #1. [Color figure can be viewed at wileyonlinelibrary.com]
