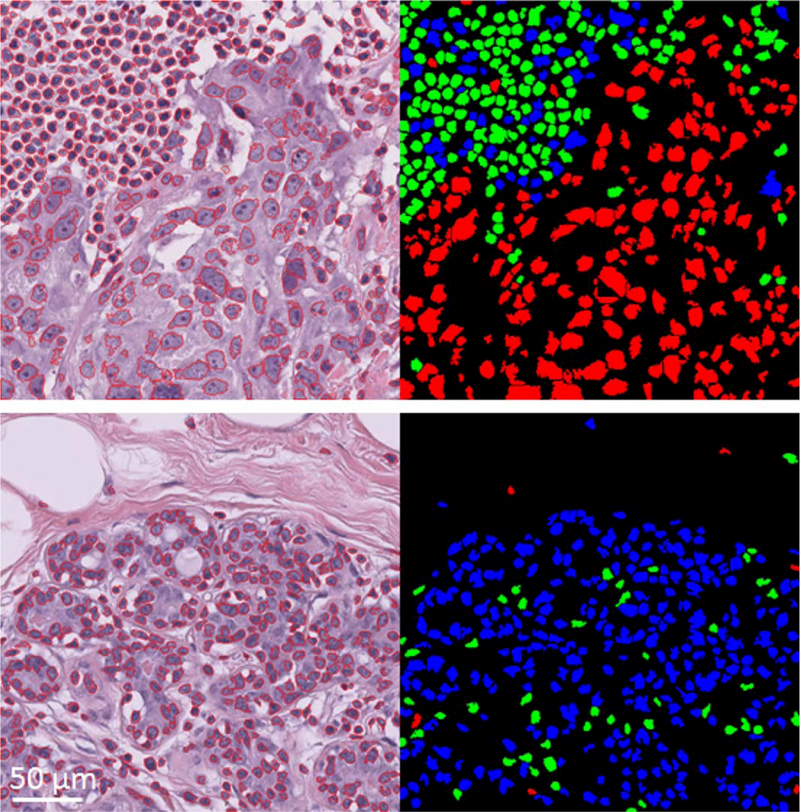
Figure 3.

Examples of nuclei figure segmentation and classification on two representative patches of size 512×512 pixels from set C. On top is an image patch covered by lymphocyte and malignant epithelial components and on bottom is an image patch covered by benign epithelial nuclei. Their classified mask images are shown to their right. Green represents lymphocyte, blue represents benign epithelial, and red represents malignant epithelial classified objects. [Color figure can be viewed at wileyonlinelibrary.com]
