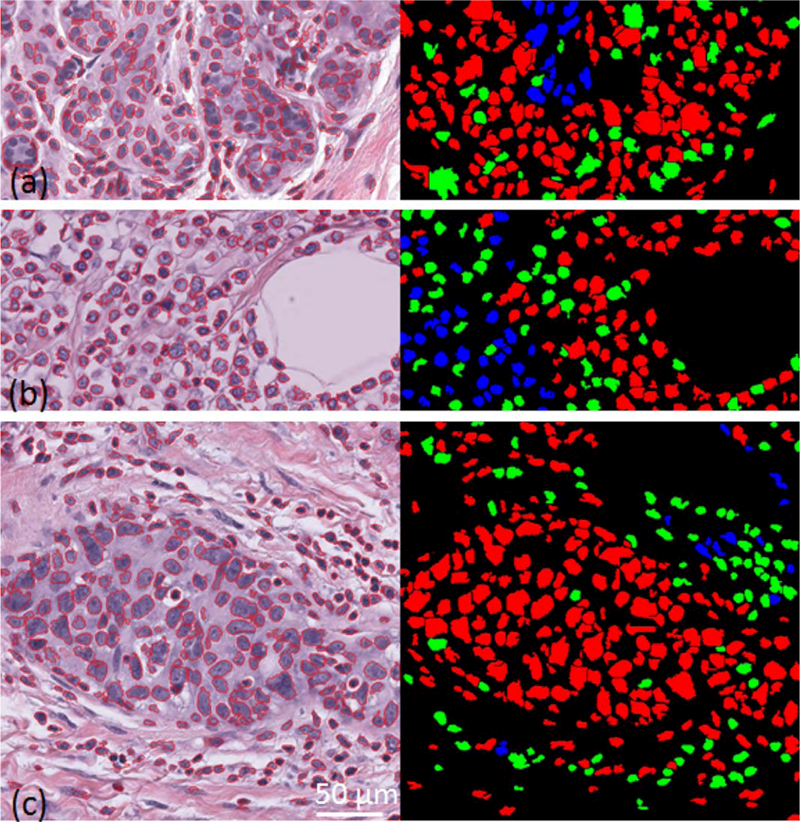
Figure 5.

Image examples where the automated pipeline fails to correctly assess the cellularity of patches with reference to that reported by pathologists: (a) part of a patch with normal epithelial tissue structure where segmentation fails to correctly identify true nuclei boundaries due to them being out-of-focus, (b) part of a patch with cancer cells are within fatty tissue; this type of tissue structures were not present in the training set and so was new to the classification pipeline, (c) an example of a patch where the difference between the assessed cellularity by automated method was large compared to at least one pathologist. [Color figure can be viewed at wileyonlinelibrary.com]
