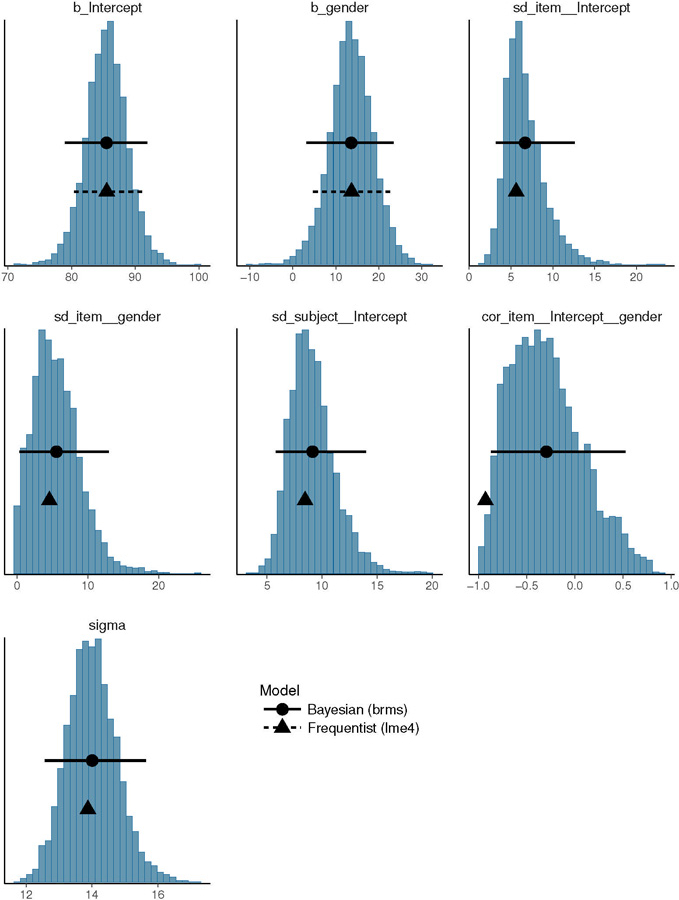
Figure 3:

Posterior distributions of the parameters for the Mandarin linear mixed effects model investigating the effect of gender on VOT. The circles and the solid lines represent the mean of the posterior and the 95% Bayesian credible intervals respectively; the triangles and the dashed lines represent the frequentist (lme4) estimates and the 95% frequentist confidence intervals respectively.
