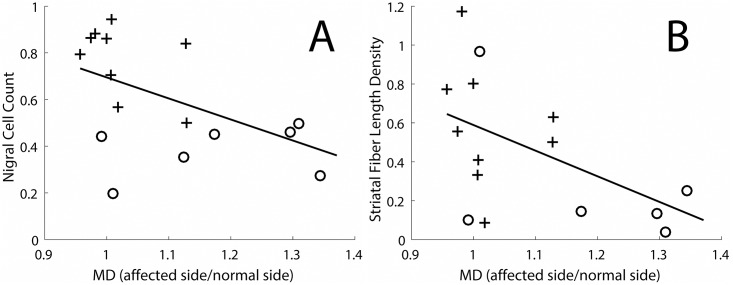
Fig 3. Nigral cell count and striatal fiber length density as a function of MD in the nigrostriatal tract.
(A) Nigral cell count as a function of the MD in the nigrostriatal tract (R2 = 0.28, p = 0.03). (B) Striatal fiber length density as a function of the MD in the nigrostriatal tract (R2 = 0.29, p = 0.04). Crosses indicate monkeys in which there was less than 50% loss of nigral cell bodies, and circles indicate monkeys in which there was a greater than 50% loss of nigral cell bodies.

