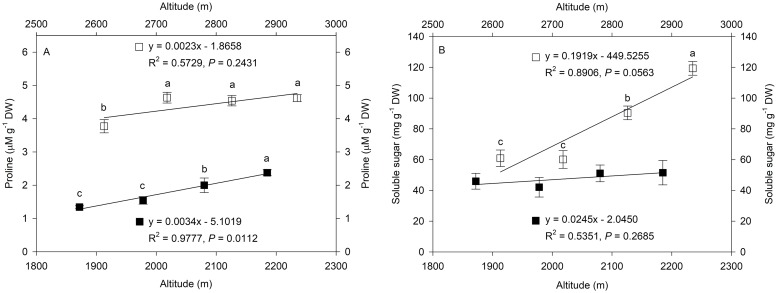
Fig 4. Changes in proline (A) and soluble sugar (B) contents along altitudinal gradients.
The symbols represent Minhe County (MH = ■) and Huangzhong County (HZ = □). The trendline, regression formula, coefficient of determination and P-value for sites in MH and HZ are shown. Values are shown as the mean ± SD of three years. Different letters indicate that the mean values are significantly different among the treatments (α = 0.05).

