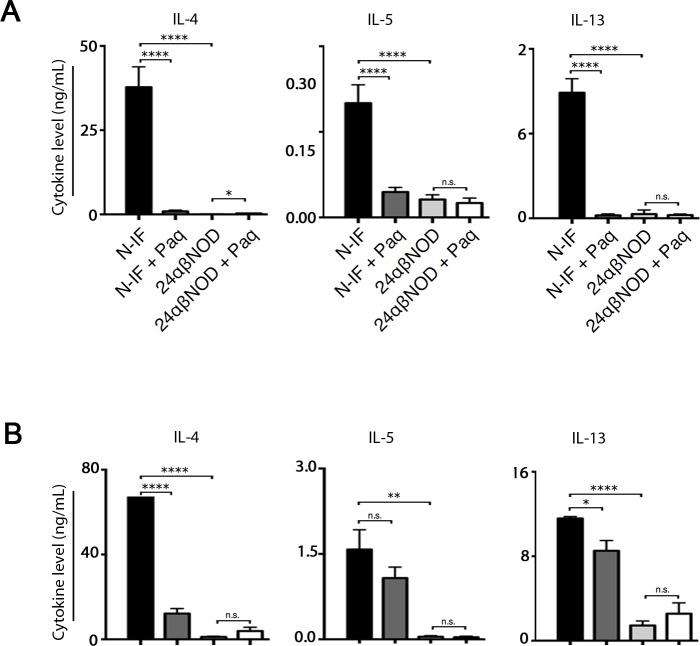
Fig 6. Paquinimod treatment reverses cytokine profile.
IL-4, IL-5 and IL-13 levels in supernatants from (A) splenocytes or (B) total liver leukocytes from non-treated N-IF mice (n = 10), N-IF mice treated with Paquinimod for 4 weeks (n = 14), non-treated 24αβNOD mice (n = 13) and 24αβNOD mice treated with Paquinimod for 4 weeks (n = 12). Isolated cells were cultured for 24 h with anti-CD3 (4 μg/ml) activation. The results are from three pooled experiments. n.s. = not significant; *P<0.05, **P<0.01, ****P<0.0001, unpaired t-test.

