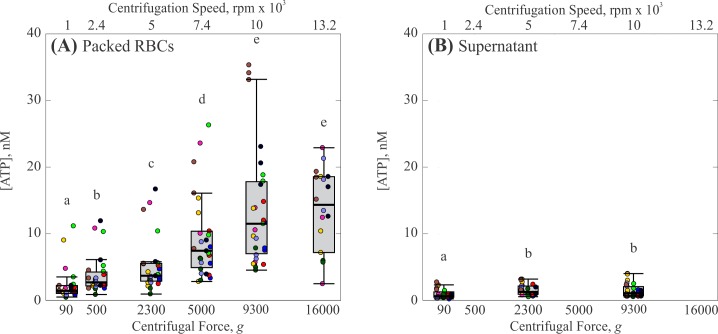
Fig 2. Effect of centrifugation force on ATP release by RBCs.
(A) Concentration of ATP in packed RBCs. (B) Concentration of ATP in the supernatant. Each gray box represents the 25th to 75th percentiles for a sample size of n = 27 measurements from 9 different participants, except at 13,200 rpm which represents n = 18 measurements from 8 different participants. Black lines inside the boxes represent the median, and whiskers correspond to the maximum and minimum for each position excluding outliers. Colored points represent individual measurements taken from each participant; different colors represent separate participants. Circles above each box represent outliers for each set. Distributions with different letters are significantly different from each other (p < 0.05).

