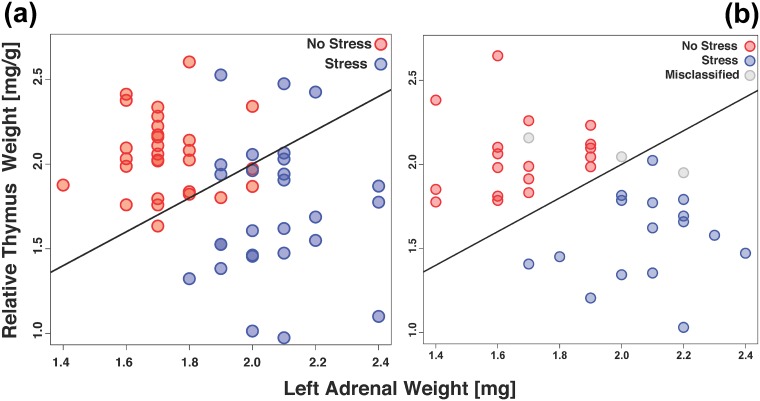
Fig 2.
(a) Scatter plot based on top scoring pairs (tsp) analysis of the training dataset aimed at classifying stressed (red) and non-stressed (blue) samples. The Left Adrenal Weight [mg] (LAWmg; x-axis) and Relative Thymus Weight [mg/g] (RTWmg/g; y-axis) were identified as the most relevant pair. The fitted line represents the linear function that discriminates the two groups. (b) The model was tested using independent validation set of 37 samples. The obtained results are shown here as a scatter plot. Correctly predicted samples (34/37 or 91.89%) are colored by matching to the colors of the test set (red = No Stress; blue = Stress). Misclassified samples (n = 3) are shown in grey.

