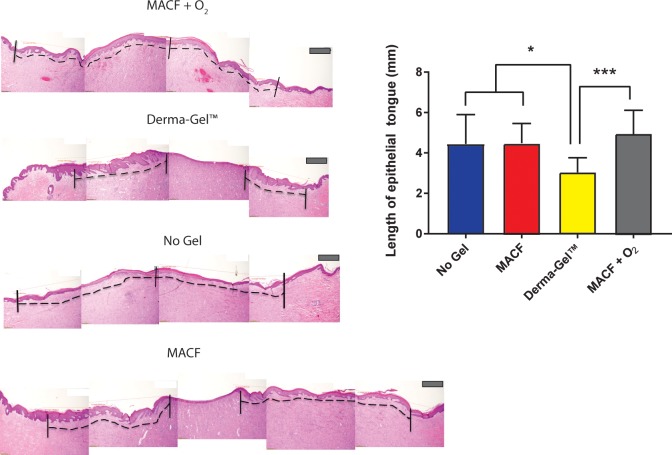
Fig 5. Hematoxylin and Eosin staining of wound tissue sections showing re-epithelialization.
* denotes significance by one factor ANOVA with Tukey’s post hoc, (p < 0.05) and *** denotes significance by one factor ANOVA, (p < 0.01). Mean+/-SD, n = 3 (pigs), s = 4 (wounds/region). The dotted line on the representative images demonstrates the length of epithelial layer from the edge of the wound to the tip of epithelial tongue. Longer epithelial tongue shows better closure and more migration of keratinocytes. Scale bar is 200 μm.

