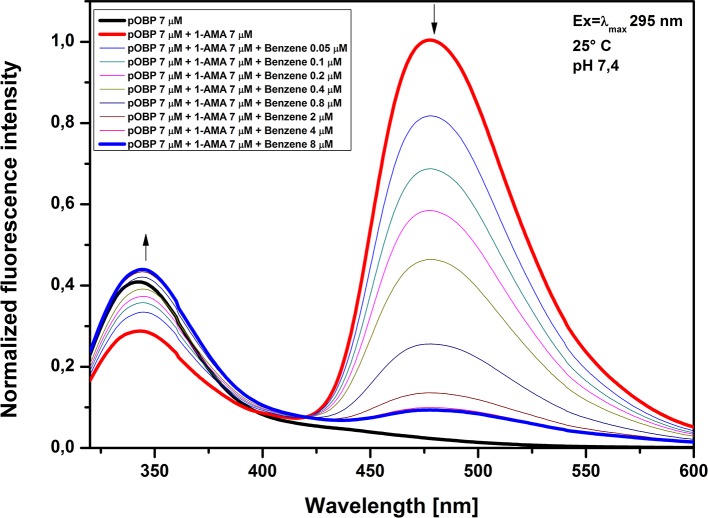
Fig 7. Fluorescence emission spectra at increasing concentrations of benzene.
Figure shows the emission fluorescence spectra of pOBP in the presence of saturating concentrations of 1-AMA. The addition of increasing amounts of benzene determines a decrease of the peak at 481 nm and an increase of the peak at 340 nm.

