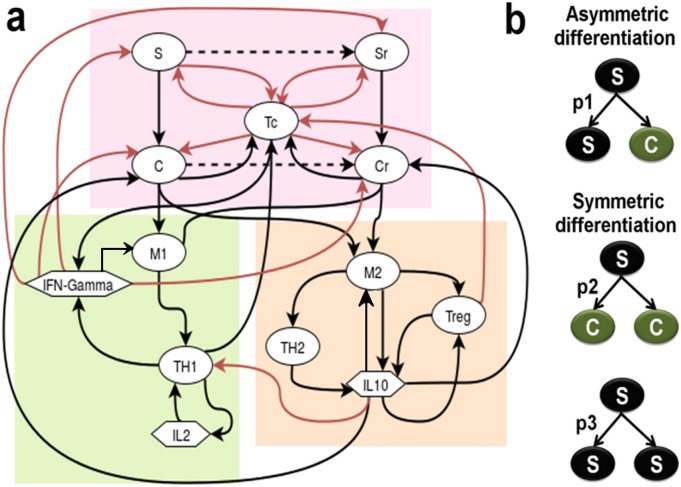
Fig 1. Diagrammatic representation of the tumor-immune interaction model.
(a) Cellular interaction network representing the key players of the tumor microenvironment, viz. Cancer Stem Cells (S), Cancer cells (C), their drug resistant counterparts (SR and CR), M1-TAM, M2-TAM, TH1, TH2, Tc, Treg immune cells, and cytokines IL10, IFN-γ and IL-2; The tumor microenvironment has been grouped into three parts, viz.- core tumor and infiltrated Tc cells (red box), the immune-stimulators (green box) and the immune-suppressors (orange box); the Black arrows represent Activation, while the Red arrow represent Inhibition; (b) Stem cell differentiation pattern.

