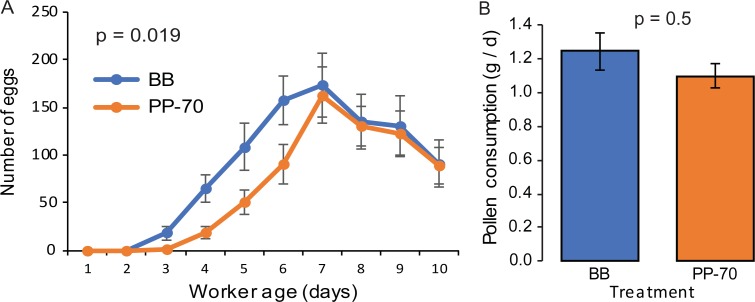
Fig 4. Effects of pollen diets on egg laying and pollen diet consumption (Experiment 3).
A. Average ± SE number of eggs laid per day in QMCs provisioned with bee bread (BB, blue) or 70% pollen paste (PP-70, orange). The p-value is the result of GEE analysis (p = 0.019, Wald Chi-Square = 5.5, df = 1). B. Average ± SE pollen diet consumed per day in BB (blue) and PP-70 (orange) treatment groups. The p-value is the result of a Wilcoxon Rank Sum test (p = 0.5, Chi-Square = 0.4, df = 1).

