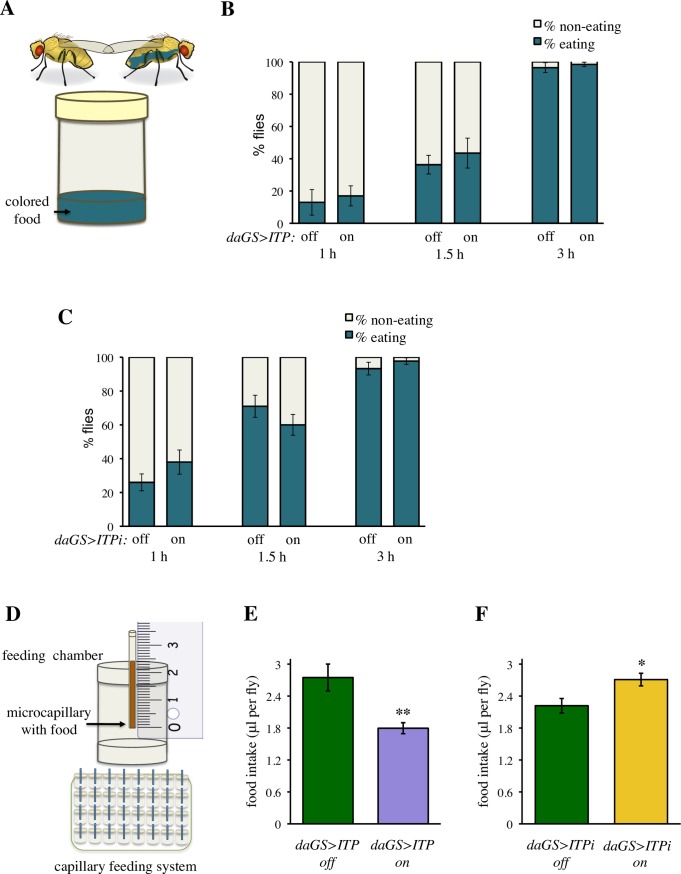
Fig 4. ITP regulates feeding.
(A) Schematic drawing of the method to measure hunger as propensity to initiate feeding. (B) Over-expression of ITP does not affect the propensity to start feeding. Fischer’s exact test: P > 0.05 at all tested time points. Animals were analyzed in four replicates, Fischer’s exact test was conducted using pooled data. Sample size: daGS>ITP off: n = 100 (1 h), n = 96 (1.5 h), n = 78 (3 h); daGS>ITP on: n = 100 (1 h), n = 86 (1.5 h), n = 76 (3 h). (C) ITPi does not affect the propensity to start feeding. Fischer’s exact test: P > 0.05 at all tested time points. Animals were analyzed in four replicates, Fischer’s exact test was done using pooled data. Sample size: daGS>ITPi off: n = 100 (1 h), n = 100 (1.5 h), n = 87 (3 h); daGS>ITPi on: n = 100 (1 h), n = 100 (1.5 h), n = 85 (3 h). (D) Schematic drawing of the capillary feeding system, which measures the total volume of food eaten during a given period of time. (E) Over-expression of ITP decreases food intake. Two-tailed Student’s t–test: P < 0.01. (F) ITPi increases food intake. Two-tailed Student’s t–test: P < 0.05.

