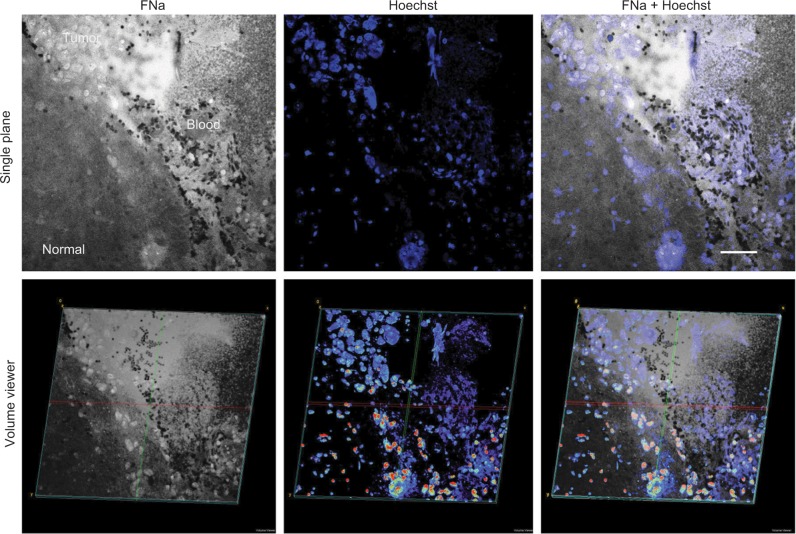
Figure 2.
2D (top) and 3D (bottom) LSM images of the same field of view showing the glioma border in mouse brain tissue. FNa was given intraoperatively, and the specimen was counterstained with Hoechst immediately ex vivo. Confocal images show higher signals of fluorescence within the tumor area with visible contours of individual tumor cells. Some of the tumor cells absorbed FNa, whereas others did not and appear darker than surrounding background. RBCs appear as hypointense areas of darkening. Hoechst stain provides visualization of nuclei and does not appear fluorescent within areas that represent the locations of RBCs. Overlapping the two images helps to confirm and reduce uncertainty between the individual characterizations of tumor versus RBCs. The lower row of images represents the 3D-reconstruction volume viewer images that were compiled using images obtained from a Z-stack. The images are angulated to help visualize the 3D nature of the image. Scale bar is 50 µm.
Note: Used with permission from Barrow Neurological Institute.
Abbreviations: 2D, two-dimensional; 3D, three-dimensional; FNa, fluorescein sodium; LSM, laser scanning microscope; RBC, red blood cell.

