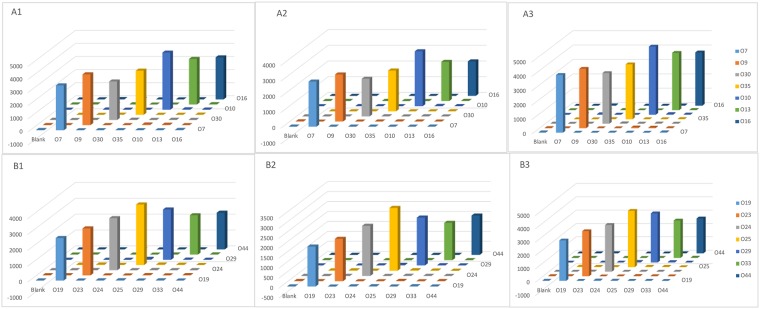
Fig 4. The hybridization results of the 14 A. hydrophila strains.
The suspension arrays were divided into 2 groups (A) O7, O9, O30, O35, O10, O13, and O16; (B) O19, O23, O24, O25, O29, O33, and O44. No cross reactions were observed for any probe tested in this study, and the ‘Blank’ indicates a negative control. The x-axis represents the PCR products of different serotypes, the y-axis represents the MFI values, and the z-axis represents the specific probes used for detection.

