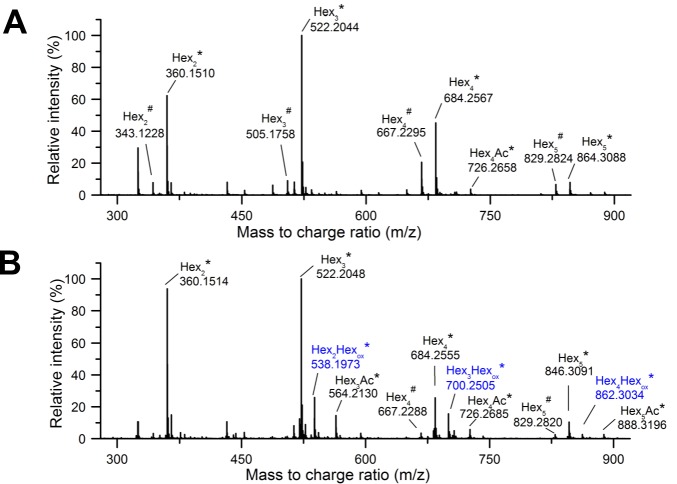
Fig 4. LC-MS analysis of oligosaccharides from LPMO-treated products from glucomannan.
Mass spectra are presented as averages over 7.5 to 15 min of the chromatographic analysis of glucomannan treated with HiLPMO9B (A) or HiLPMO9I (B) in presence of ascorbic acid, and subsequent depolymerization with MtEG7. Native (black) and oxidized (blue) glucomannan oligosaccharides were mainly detected as ammonium adducts (*) and to a much less extent as proton adducts (#) in the MS analyses.

