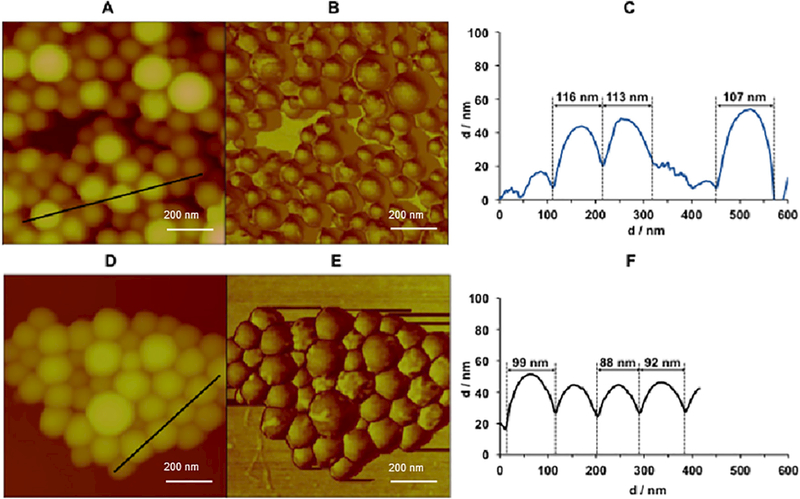
Fig. 3.
NP (A, B and C) and non-PEGylated NP (D, E and F) surface morphology by atomic force microscopy (AFM) (0.715 × 0.715 μm2). Topography (A and D), Phase (B and E) and NP diameter (C and F). Mean diameters were calculated from 50 individual NP from section analysis (black lines A (Z = 600 nm) and D (Z = 414 nm)) of three different areas.

