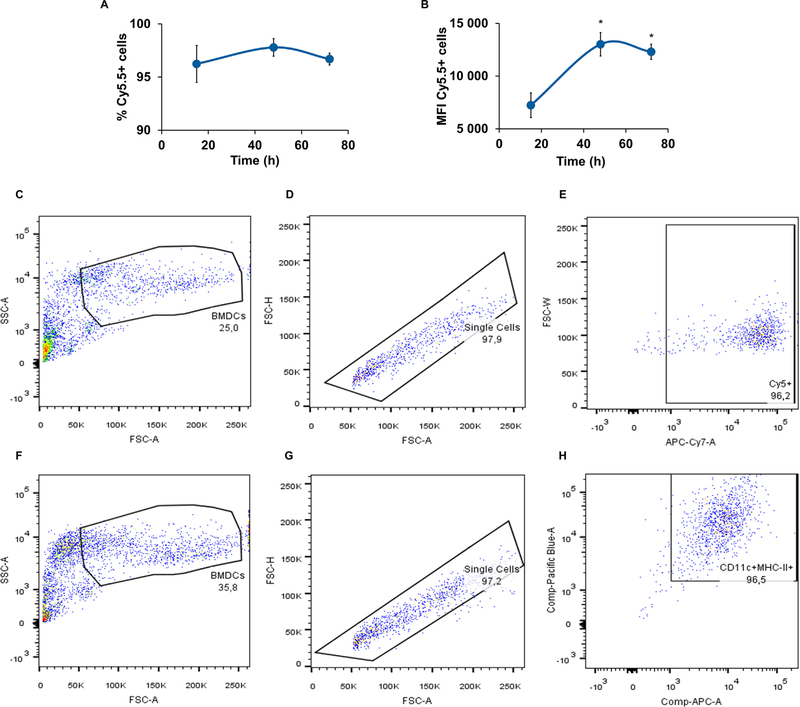
Fig. 5.
Uptake of NPs after 15 h, 48 h and 72 h of incubation with BMDCs, expressed as percentage of positive cells (A) and mean fluorescence intensity (MFI) in the sorted population by flow cytometry (B). Gating strategy of the uptake study (C, D and E) and evaluation of BMDC purity (F, G and H). Mean ± SD; N = 3, n = 3, where N stands for the number of independent experiments and n stands for the number of measurements per experiment. One-way ANOVA and Tukey’s Post Hoc test were used to compare internalization levels at any time point up to 72 h incubation: *p < 0.01.

