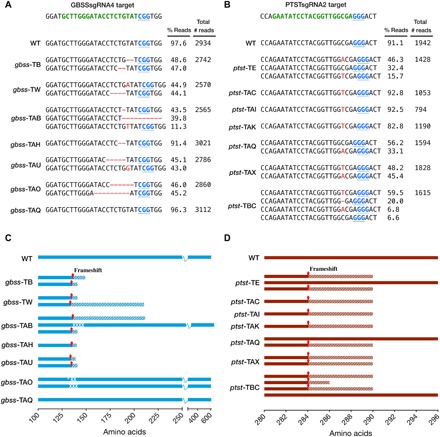
Fig. 2. Sequence analysis of indels and predicted translation of reads in gbss and ptst lines.

(A and B) PacBio SMRT sequencing of amplicons derived from gbss and ptst lines, respectively. The WT sequence is shown at the top of each alignment, with the protospacer adjacent motif (PAM; blue font and underlined) and sgRNA target site (green font). Nucleotide deletions are depicted as red dashes, and nucleotide insertions are in uppercase, red font. The number of reads per line is shown, together with the percentage of reads clustered according to indel sequence in the target site region. The most abundant sequence clusters for each line are shown. Low-abundant clusters (<5% of total reads) are not shown here since they are likely to be artifacts. Sequence data for WT are also shown as a control to determine conservation of sequence, following tissue culture and regeneration from callus. (C and D) Predicted polypeptides from gbss and ptst lines, respectively. The positions of frameshift mutations are indicated by red arrows, and hatched areas represent potentially translated regions until the next predicted termination codon. Predicted amino acid substitutions (white tick) and deletions (white cross) are indicated in gbss-TAB and gbss-TAO.
