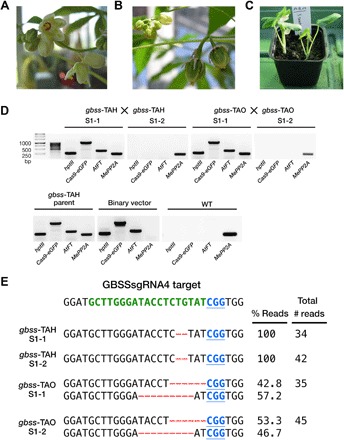
Fig. 5. Early flowering in glasshouse-cultivated gbss lines and molecular characterization of S1 progeny.

(A) Inflorescence on a gbss-TAB plant. (B) Developing fruit following manual pollination (selfing) on a gbss-TAH plant. (C) S1 progeny plantlets following manual pollination (selfing) and seed germination between gbss plants. (D) PCR amplification products of hptII, Cas9-eGFP, AtFT, and endogenous MePP2A. Reactions contained genomic DNA template from S1 progeny samples, a parent control (gbss-TAH), a vector control (binary vector), and WT. (E) Sequence of cloned amplicons derived from the GBSSsgRNA4 genomic target sequence in S1 lines. The WT sequence is shown at the top of the alignment and comprises the PAM (blue font and underlined) and the sgRNA target site (green font). Nucleotide deletions are depicted as red dashes. Number of reads and percentage distribution between indels from the sequenced population are provided.
