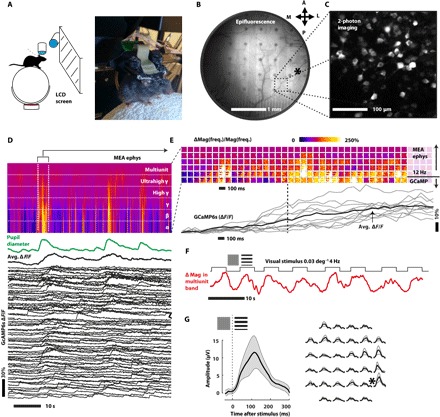
Fig. 4. Simultaneous two-photon Ca++ imaging and electrophysiological recording from a bilayer-nanomesh MEA on the brain of an awake mouse.

(A) Head-restrained awake mouse on a floating styrofoam ball, watching visual stimuli. (B) Wide-field epifluorescence of the visual cortex and the surrounding areas. The asterisk indicates the binocular area of the visual cortex. (C) Temporal autocorrelation from a two-photon imaging movie (1-s lag), indicating neurons expressing the Ca++ indicator GCaMP6s. (D) Simultaneous electrophysiology recording (spectrogram, top), arousal (pupil diameter, middle), and two-photon imaging (ΔF/F traces representing single-neuron Ca++ activity (bottom). (E) Magnification of the spectrogram and Ca++ traces during the onset of a spontaneously induced high arousal event. Each square contains the increase in magnitude of the 32-channel electrophysiology signal in a specific frequency band (from top to bottom: α, β, γ, high γ, ultrahigh γ, and multi-unit). The dashed line is a guide to the eyes to show when the average GCaMP expression is rising (the line corresponds to the 50% of the maximum ΔF/F). (F) Modulation of the power in the high-frequency band (average on all 32 channels) during the alternation of visual stimuli and gray screen. (G) Visual-evoked response in the time domain (lower frequency). The asterisk indicates the position of the binocular area of the visual cortex. LCD, liquid crystal display.
