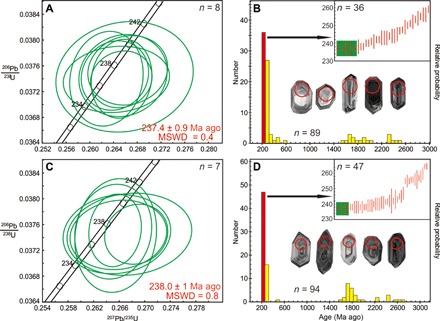
Fig. 2. U-Pb geochronology for samples from layers bearing Tongchuan entomofauna.

U-Pb concordia plots for zircons in youngest ages (left) and frequency histograms (right) of detrital age populations from sample TC-01 (A and B) and sample TC-02 (C and D). Black arrows showing rank order plots (green bars represent youngest ages). Select cathodoluminescence (CL) images of zircons are in frequency histograms (age, 237 Ma ago; red circle diameter, 40 μm).
