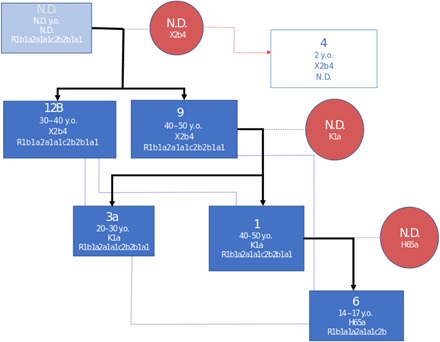
Fig. 3. Reconstruction of first- and second-degree relatedness among all related individuals.

Bold black lines and blue lines indicate first- and second-degree relatedness, respectively. Dark blue squares are identified males with age-at-death estimates years old (y.o.), mtDNA haplotypes, and NRY haplogroups. Red circles represent unidentified females that passed maternal haplotypes to their offspring. The light square represents one male infant that shares its maternal haplotype with individuals 12B and 9. N.D., not determined.
