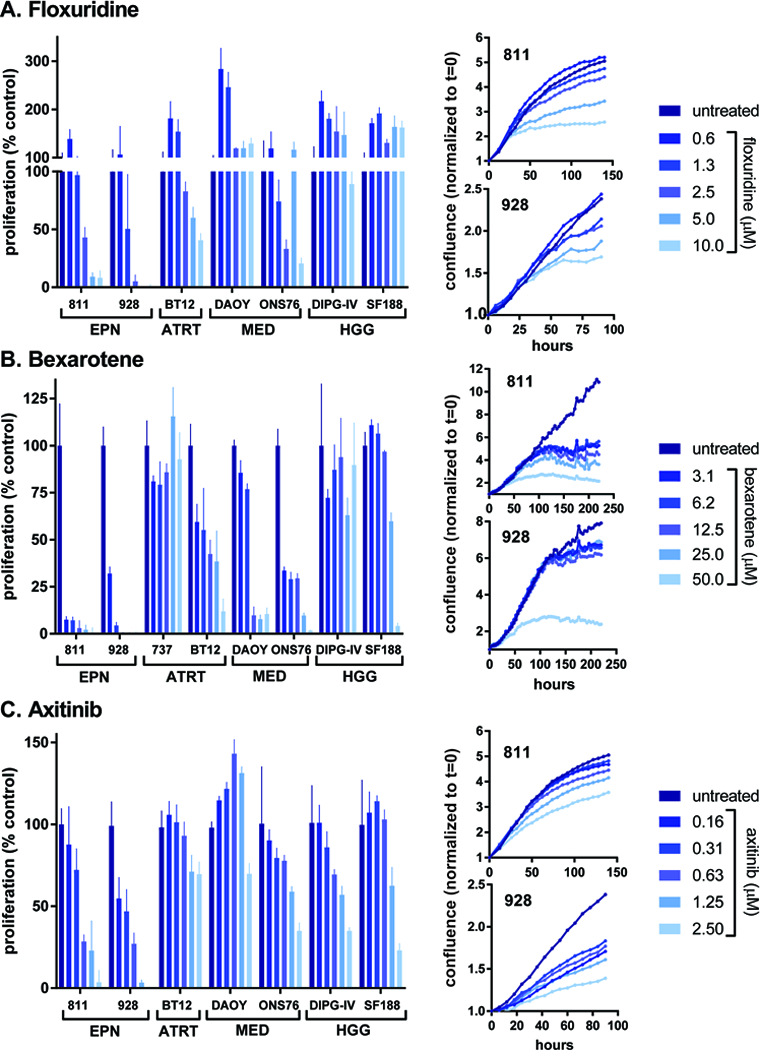
Figure 2. Dose response effect and time courses for EPN-selective drugs floxuridine, bexarotene and axitinib.

Treatment responses for (A) floxuridine, (B) bexarotene, and (C) axitinib, representing each of the 3 EPN-selective drug classes identified by FDA library screening. Bar graphs (left) represent dose response effects on proliferation normalized to untreated controls (% control), measured by tritiated thymidine incorporation, in EPN cell lines (811 and 928) and comparator cell lines from other pediatric brain tumors(ATRTs 737 and BT12; MEDs DAOY and ONS76; HGGs DIPG-IV and SF188). Treatments were performed in triplicate (error bars represent standard deviation). Growth curve time courses (right) for EPN cell lines 811 and 928 treated with a range of doses of (A) floxuridine, (B) bexarotene, and (C) axitinib, as measured by live cell imaging (IncuCyte) of confluence. Each treatment was performed in triplicate and values are given as confluence normalized to time of treatment (t=0) for each well.
