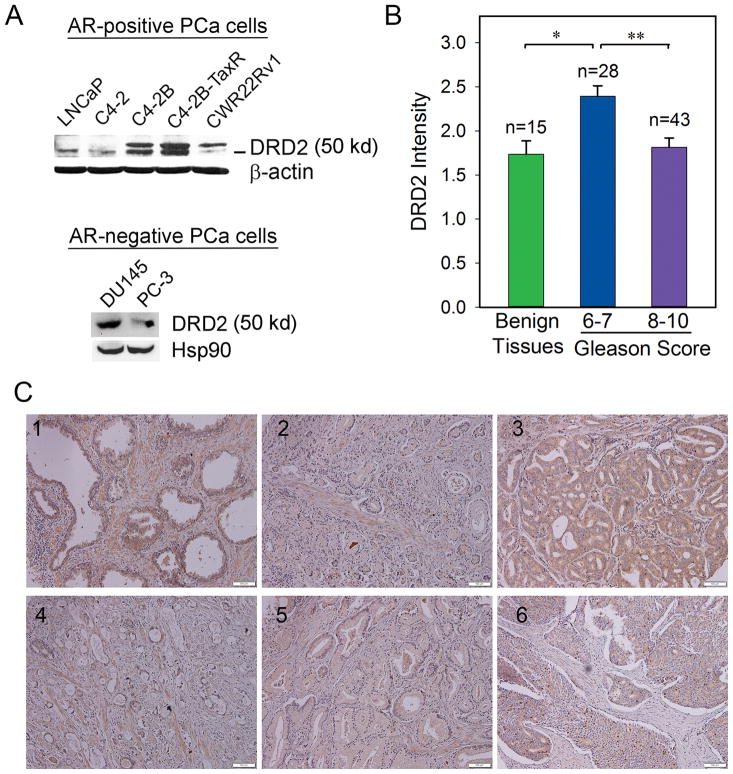
Figure 1. Expression of DRD2 in human PCa cell lines and prostate tissue specimens.
(A) Western blot analysis of DRD2 protein expression in PCa cell lines. β-actin or Hsp90 was used as loading control. (B) Relative DRD2 intensity in a human TMA containing normal/benign prostate tissues and PCa. *, ** p < 0.001 (t-test). (C) Representative IHC staining of DRD2 expression in normal/benign human prostate tissues (#1) and PCa tissues with different Gleason scores of 6 (#2), 7 (#3), 8 (#4), 9 (#5) and 10 (#6).

