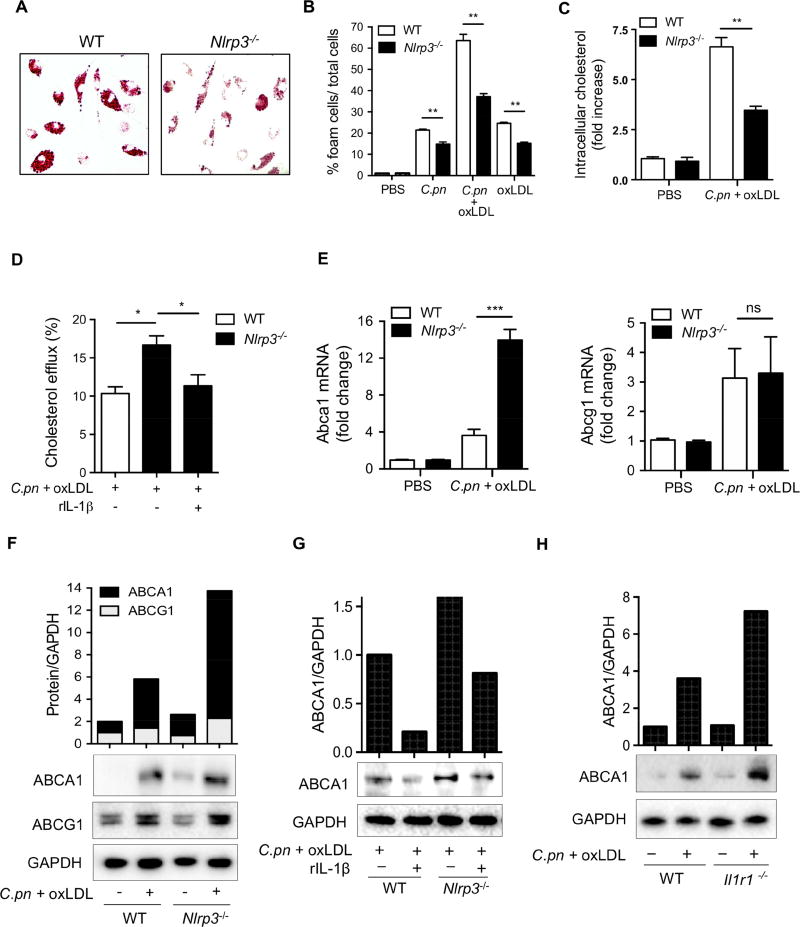
Figure 3. IL-1 signaling suppresses ABCA1-cholesterol efflux in C.pn-infected macrophages and promotes foam cell formation.
(A) Representative pictures of foam cells stained with Oil red O are shown.
(B) Foam cell formation has been quantified from the peritoneal macrophages obtained from WT and Nlrp3−/− mice and stimulated with C.pn infection and oxLDL for 24hours as indicated in the figure. The intracellular lipids were stained with Oil Red O and foam cells were expressed as the percentage of positive cells.
(C) Intracellular cholesterol was measured by a fluorometric assay kit. Cholesterol measurements were normalized to total cellular protein content.
(D) Cholesterol efflux was measured using cholesterol efflux assay kit in WT and Nlrp3−/− peritoneal macrophages that were treated with C.pn and oxLDL as indicated.
(E) Fold change of ABCA1 and ABCG1 mRNA levels in WT and Nlrp3−/− peritoneal macrophages that were treated with C.pn and oxLDL are reported.
(F) Western blot (WB) and band densitometric analysis of ABCA1 and ABCG1 protein in lysates from WT and Nlrp3−/− peritoneal macrophages that were treated with C.pn and oxLDL as indicated.
(G) Peritoneal macrophages from WT and Nlrp3−/− mice were treated with C.pn and oxLDL for 24 hours were also treated with rIL-1β (5 ng/ml) or vehicle. ABCA1 protein was detected from cell lysates by WB and band densitometric analysis.
(H) Macrophages from WT and Il1r1−/− were treated with C.pn and oxLDL as indicated.
ABCA1 protein was determined from cell lysates by WB and band densitometric analysis.
A typical picture of three separate experiments is shown in A and F-H. All data represent mean ± SD; n≥3, Statistical significance was determined using Student’s t-test (D) and One-Way ANOVA with Tukey’s post-hoc test (B-E), denoted as *p<0.05, **p<0.01, ***p<0.001. Both male and female mice were used.

