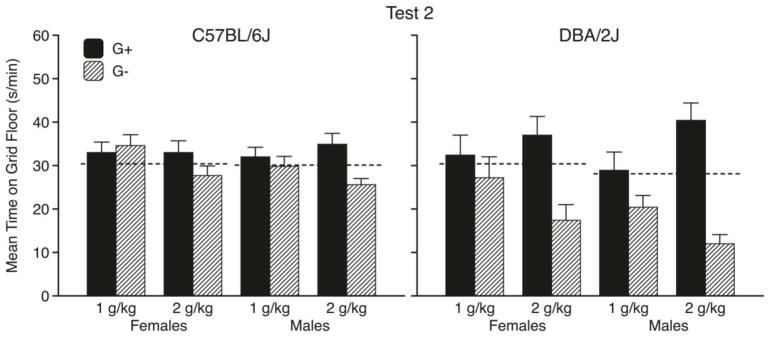
Figure 3.
Mean time spent on the grid floor (s/min ± SEM) by C57BL/6J mice (left panel) and DBA/2J mice (right panel) during the second preference test (after all four ethanol conditioning trials) in each Sex x Dose conditioning subgroup. Each bar depicts data from 11–12 mice. (G+ = GRID+; G− = GRID−). Dashed lines depict overall mean times spent on the grid floor during the pretest by each Strain x Sex group. Analyses based on individual changes from the pretest baseline scores can be found in the supplementary material (Figure S1).

