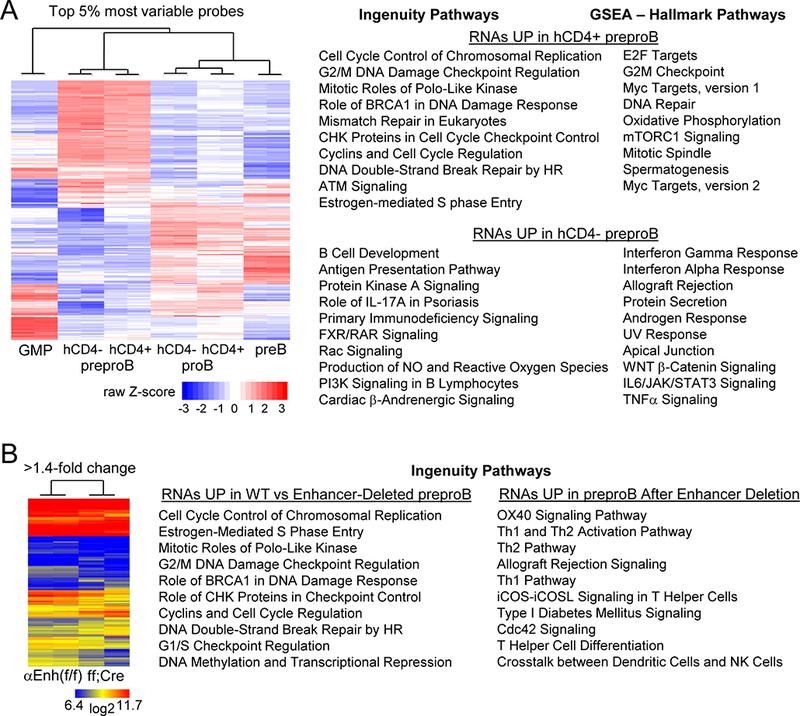
FIGURE 7.

Global gene expression analysis of B cell precursors in Cebpa Enh/prom-hCD4 and Enh(f/f) versus Enh(f/f);Mx1-Cre mice. (A) Heat map for the top 5% most variable probes after microarray analysis of indicated Cebpa Enh/prom-hCD4 marrow subsets from two mice (left). GMP represents hCD4+ GMP. The top ten Ingenuity and Hallmark Pathways resulting from analysis of RNAs increased >2-fold in hCD4+ or in hCD4- preproB cells are shown (right). The p-values for the Hallmark pathways higher in hCD4+ cells ranged from <0.001 to 0.049, and for the pathways higher in hCD4- cells from <0.001 to 0.015. P-values for the Ingenuity Pathways, along with R values indicating the proportion of genes in each pathway affected, are provided (Table SI). (B) Heat map for those RNAs with >1.4-fold change comparing preproB cells from two Cebpa Enh(f/f) with two Enh(f/f);Mx1-Cre mice exposed to pIpC (left). The top ten Ingenuity Pathways resulting from analysis of RNAs increased in Enh(f/f) compared with enhancer-deleted preproB cells or those increased after enhancer deletion are shown (right). P-values for these pathways, along with their R values are provided (Table SII).
