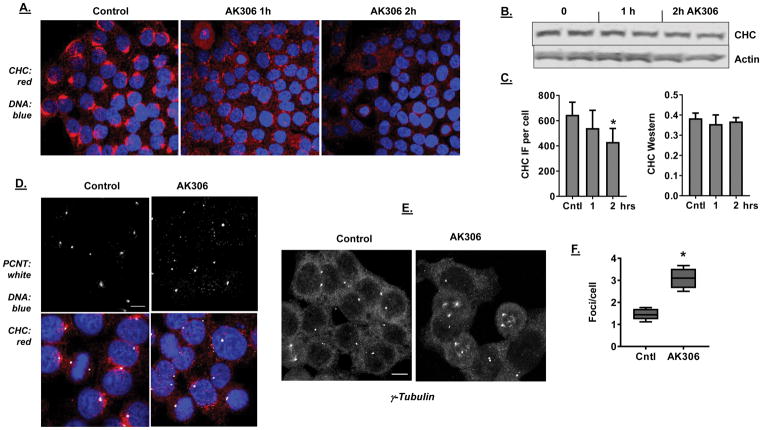
Figure 4.
A) Dispersion and reduction in CHC staining in response to AK306 treatment. HCT116 cells were treated with AK306 for 1 or 2 hours. Treated cells were fixed and stained with CHC antibody. Confocal images show disrupted CHC distribution and reduced CHC staining in AK306-treated cells. B) Western blot of CHC expression after 1 or 2 hours AK306 treatment. C) Quantification of CHC fluorescent staining and expression. The left panel quantifies the data from 4A and shows a reduction in CHC staining after 2 hours of treatment (p < 0.01). The right panel quantifies the Western blot data from 4B. D) Effect of AK306 on pericentrin. HCT 116 cells treated with AK306 (for two hours) were immunostained for pericentrin (PCNT) and analyzed confocal microscopy. Representative images show pericentrin localized at centrosomal foci in control cells, while AK306 caused the formation of multiple additional foci dispersed throughout the cells. Bar indicates 10 μm. E) Representative confocal images of cells stained for γ-tubulin before and after treatment with AK306. Cells were treated as in 4D, with the exception that 50 nM AK306 was used. F) The number of pericentrin foci per cell was quantified using FIJI particle counter. Quantification of large pericentrin foci (at least half the integrated fluorescence intensity of foci in control cells). The quantification indicated a significant increase in the number of foci after AK306 treatment (p < 0.01).

