Figure 6.
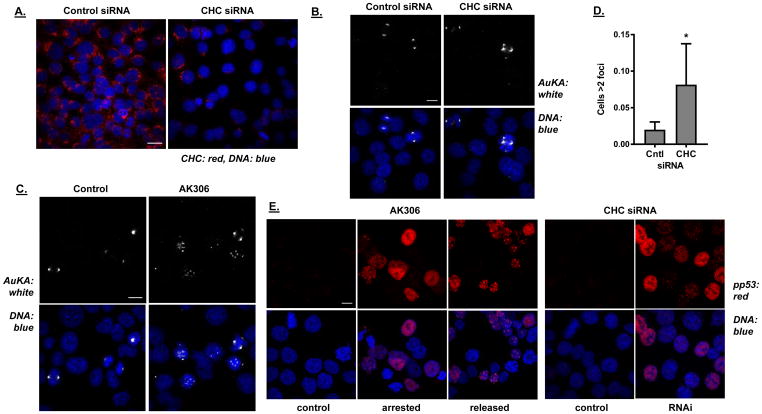
A) HCT116 cells were transfected with CHC siRNA or control (nontargeting) siRNA. After two rounds of transfection, immunostaining was performed with antibodies to CHC. Efficiency of CHC inhibition was assessed by immunofluorescence visualization using confocal microscope. Left image shows expression of CHC in the control cells and right image shows expression after knockdown with CHC siRNA. The bar shown indicates 20 μm. B) The effect of CHC knockdown on centrosome complex assembly was investigated by immunostaining for centrosome-associated Aurora kinase A (AuKA). Compared to control cells (left panel), an increase in the number of mitotic cells with multiple AuKA foci appear after CHC knockdown (two right panels). The bar shown indicates 20 μm. C) Representative images of AK306-treated cells (50nM) showing multiple Aurora A foci. The bar shown indicates 20 μm. D) Quantification of the increase in AuKA foci in CHC siRNA transfected cells. Cells with more than two AuKA foci were counted using the A1R confocal microscope 60× objective. A significantly greater number of cells with multiple AuKA foci appears after CHC siRNA transfection (Student’s t-test; p < 0.01). E) CHC depletion leads to p53 phosphorylation at serine-15. Left panel shows phosphorylation of p53 in response to AK306 treatments. HCT116 cells were treated with AK306 overnight (16 hours) and then released for 3 hours, as indicated. Cells were then stained for phospho-p53 (ser-15). Nuclear staining is seen in treated and released cells, but not in control cells. Right panels similarly show phospho-p53 nuclear staining in CHC siRNA knockdown cells, which is absent in the non-targeting siRNA controls. The bar shown indicates 10 μm.

