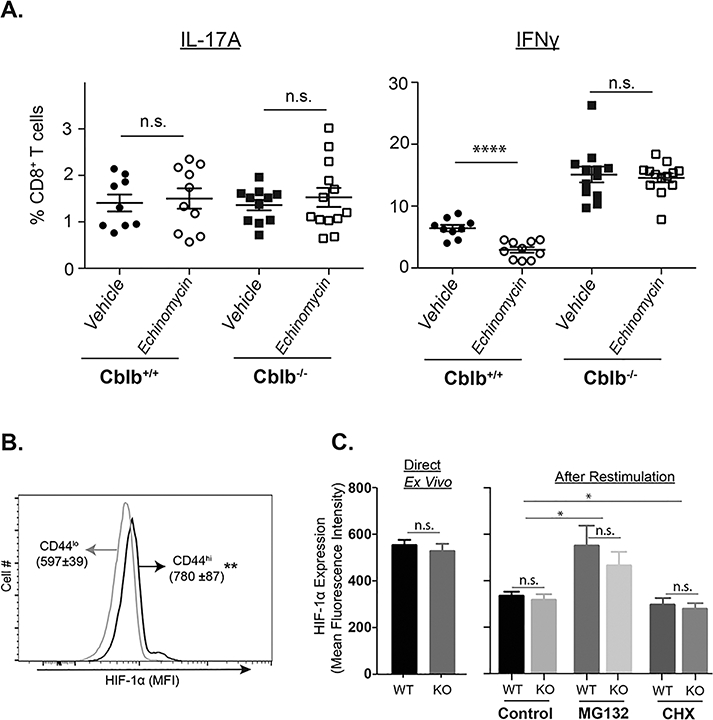
Figure 8. HIF-1α requirement for antifungal CD8+ T cell responses.

Naïve Cblb+/+ and Cblb−/− mice were vaccinated with attenuated strain #55 yeast. Cohorts of mice received either vehicle or Echinomycin (3 μg/mouse) every other day starting from day 4 post-vaccination (A). On day 14–16, dLNs were harvested to analyze cytokine-producing CD8+ T cells by flow cytometry. Scatter diagrams show frequency of cytokine-producing cells among CD8+ T cells. Each individual marker represents the value from a single mouse. Data is pooled from two independent experiments. (B & C) On day 16, dLNs were harvested to analyze HIF-1α levels in CD8+ T cells in the presence of Cyclohexamide (CHX; 10μM; EMD Millipore) or MG132 (50μM; EMD millipore). Data is representative of two independent experiments. Values are mean ± SD. N=4–5 mice/group. *p≤0.05, **p≤0.01 and ****p≤0.0001.
