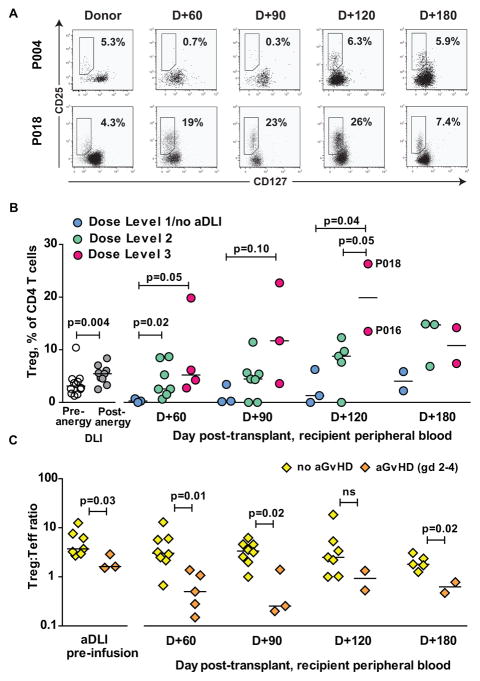
Figure 4. Reconstitution of CD4+ regulatory T-cells (Treg) after T-cell depleted haploidentical HSCT and aDLI.
(A) CD4+ Treg in donor and patient peripheral blood after T-cell depleted haploidentical HSCT and infusion of aDLI. Representative dot plots are shown for patients who received aDLI at a dose of 103 CD3+ T-cells/kg (P004) and aDLI at a dose of 105 CD3+ T-cells/kg (P018). Boxed regions contain CD25+CD127lo Tregs and numbers denote the frequencies of Treg expressed as a percentage of CD4+ T-cells.
(B) Frequencies of CD4+ Treg in DLI before and after alloanergization, and patient peripheral blood after T-cell depleted haploidentical HSCT and infusion of aDLI. Values are shown for 14 patients eligible for immune reconstitution studies grouped according to dose of aDLI. Horizontal lines are medians. Treg frequencies at D+120 in two patients who also had large expansions of peripheral blood virus-specific T-cells post-transplant (P016, CMV-specific T-cell expansion) and P018, adenovirus-specific T-cell expansion) are highlighted.
(C) Ratio of frequencies of CD4+ Treg;Teffector cells in aDLI, and in patient peripheral blood after T-cell depleted haploidentical HSCT and infusion of aDLI. Values are shown for 13 patients eligible for immune reconstitution studies grouped according to whether they did or did not develop acute GvHD (grades 2–4). Horizontal lines are medians.

