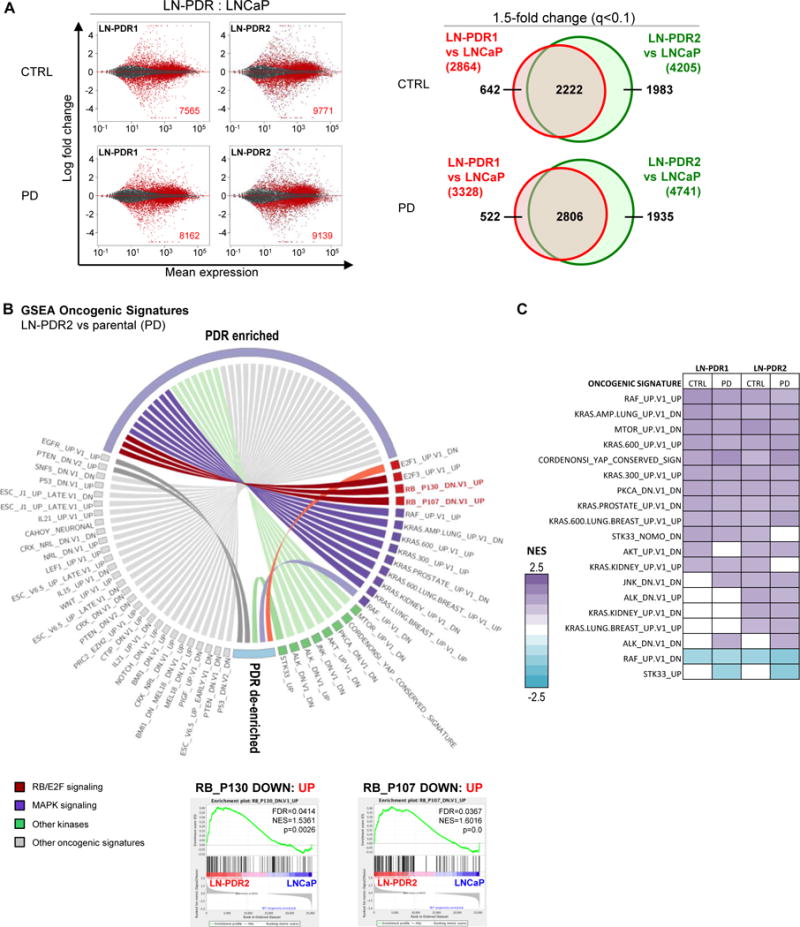
Figure 2. Acquired CDK4/6 inhibitor resistance is associated with rewired transcriptional programs including RB function.

A. RNAseq was performed on PDR1/2 and parental LNCaP cells treated 24h with 0.5μM PD or vehicle (CTRL). The MA plots (right) represent the log ratio (M) of PDR versus parental values over the average log intensity (A) of each transcript, which visualizes vast differences between the PDR vs parental data (red dots and inset numbers indicate significant hits, q-value<0.1). Venn diagrams show overlap between PDR1 and PDR2 of genes >1.5x differentially expressed compared to the parental cells (q-value<0.1; right). B. The complete RNAseq profiles for each PDR vs parental model comparison were subjected to unbiased Gene Set Enrichment Analysis (GSEA, MSigDB) to determine enrichment of predefined Oncogenic Signatures in both PDR1 and PDR2 compared to parental cells under at least one condition (CTRL/PD) with a False Discovery Rate or FDR<0.25 (Complete list in Supplementary Figure 2B). The Oncogenic Signatures enriched in the PDR models included two signatures defined by RB knockdown, suggesting the PDR models have upregulated genes that are induced by RB knockdown. Representative GSEA plots of the RB knockdown signatures are shown for PDR2 vs WT after PD treatment. C. GSEA Oncogenic Signature altered kinase signatures in the LNCaP PDR models for all conditions.
