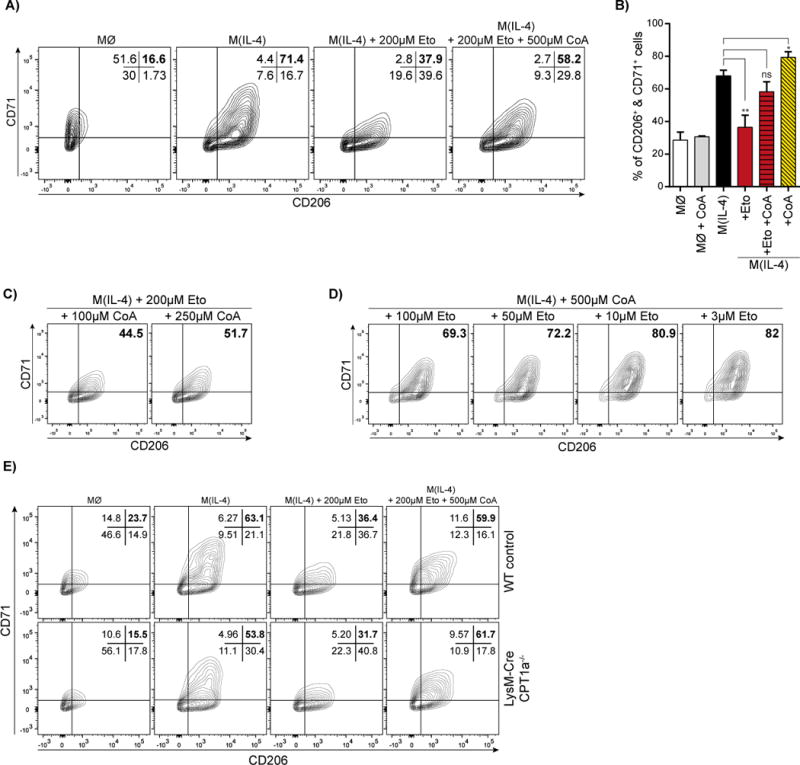
Figure 5. Coenzyme A (CoA) rescues inhibition of M(IL-4) polarization by excess etomoxir.

(A) Flow cytometric analysis of CD206+/CD71+ BMDMs after 24 hr treatment with 200 μM etomoxir ± 500 μM CoA. The data shown are from one experiment representative of a total of six independent biological replicates.
(B) Aggregate data of the CD206+/CD71+ population in response to 200 μM etomoxir with or without 500 μM CoA. (n = 6 independent biological replicates)
(C) Flow cytometric analysis of BMDMs showing CD206+/CD71+ in the presence of 200 μM etomoxir and varying the concentration of added CoA. The data shown are from one experiment representative of a total of three independent biological replicates.
(D) Flow cytometric analysis of CD206+/CD71+ BMDMs in the presence of 500 μM CoA and varying the etomoxir concentration between 3-100 μM etomoxir. The data shown are from one experiment representative of a total of three independent biological replicates.
(E) Flow cytometric analysis of the CD206+/CD71+ population in WT and Cpt1a−/− BMDMs in response to IL-4 ± 200 μM etomoxir ± 500 μM CoA. The data shown are from one experiment representative of a total of four independent biological replicates.
See also Supplementary Fig. 5
