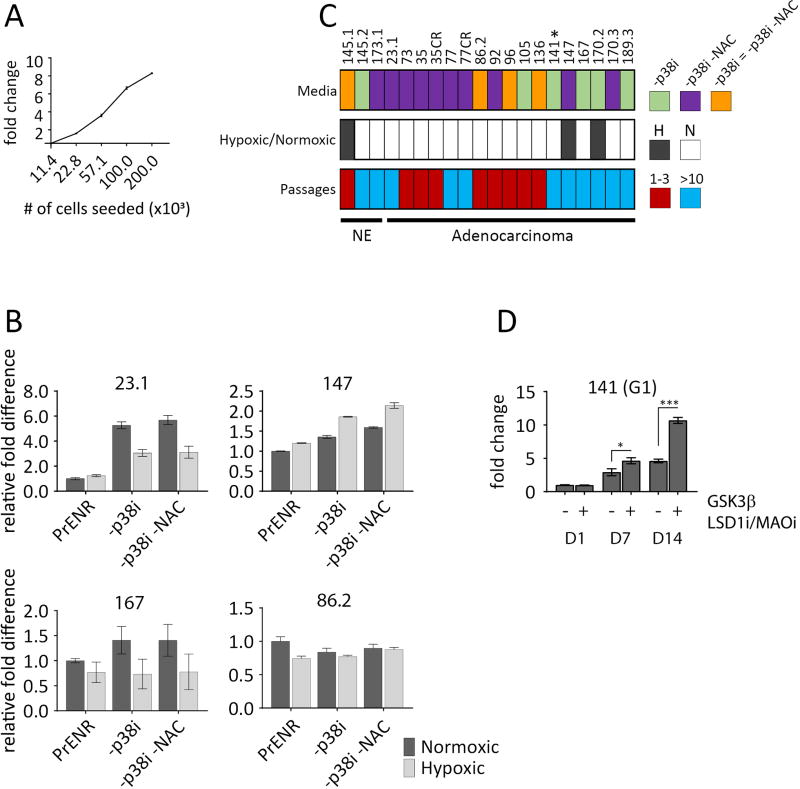
Figure 1.
Comparison of culture conditions by relative cell viability. A, CellTiter Glo 3D assay is linear over a broad range of cell densities. Normal liver cells seeded in 3D in PrENR at 2-fold increasing numbers, assayed after 96hr by CellTiter Glo 3D. X axis is the number of cells seeded, Y axis is the fold difference relative to the lowest number of cells seeded. Error bars represent the standard error of the mean. B, An equal number of generation 1 (G1) cells were plated in 3D and then cultured for two weeks in either a normoxic or hypoxic atmosphere in standard PrENR, PrENR minus p38i, or PrENR minus p38i and NAC. Graphs represent a comparison of the viable organoids among each condition assayed by CellTiter Glo 3D. The Y axis indicates the fold difference set relative to the PrENR/normoxic condition. Error bars represent the standard error of the mean. Two independent experiments were performed. C, Summary of positive culture conditions for all LuCaPs tested. Top row, colored boxes indicate the media condition(s) that best supported growth for a given LuCaP. *LuCaP 141 requires additional components (see D). Middle row, filled boxes indicate that a given LuCaP grew best in a hypoxic atmosphere. Empty boxes indicate that a LuCaP grew best in a normoxic atmosphere. Bottom row, colored boxes indicate the number of generations that a given LuCaP could be grown in organoid culture. Red = 1–3 generations, Blue = at least 10 generations. D, Specific additional modifications allow for growth of LuCaP 141 organoids that do not otherwise survive in culture. G1 LuCaP 141 cells were plated, in −p38i or −p38i +GSK3β inhibitor (3µM) +LSD1/MAO inhibitor (2 µM) media, and assayed for proliferation by CellTiter Glo 3D at days 1, 7, and 14. Graphs show the change in cell number over time relative to day 1 in the −p38i condition. Error bars represent the standard error of the mean of three replicates. Student’s t-tests were performed; *P < 0.05, ***P < 0.0001. Representative figure of three independent experiments is shown

