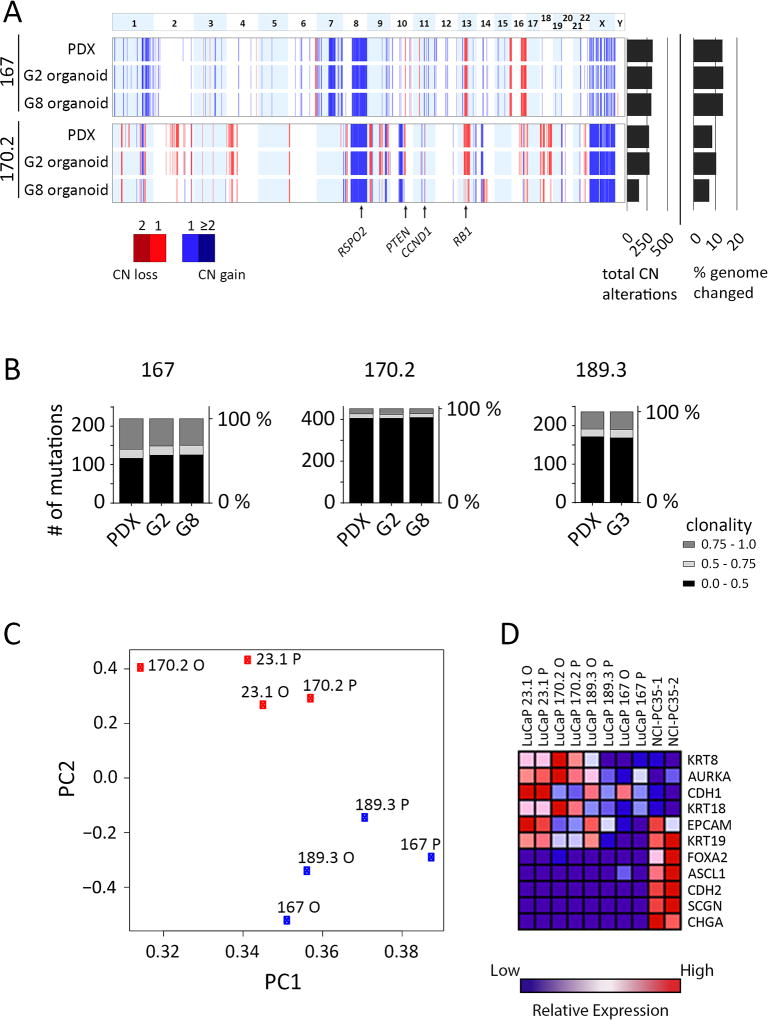
Figure 4.
Genomic and phenotypic comparisons of parental PDX tumor to organoids. A, Landscape view representing copy number alterations identified in the PDX and organoids for LuCaPs 167 and 170.2. Top panel represents chromosome number. Data for PDX, G2 and G8 organoids are shown. Total copy number aberrations and percentage of genome changed are shown at the right. The locations of specific genes are indicated by arrows below the figure. B, Comparison of exome somatic mutations between PDX and early and later generation organoids. Mutations were filtered so that at least one sample of a given LuCaP contained a minimum fraction of 0.2. Stacked column graphs show the total number of mutations binned by fraction (0.0–0.5, 0.5–0.75 and 0.75–1.0), for each sample. C, LuCaP PDXs and organoids cluster together by transcriptomic profile. Principle component analysis of PDX and organoid gene expression determined by RNA-seq. Proportion of variance PC1 = 0.64, PC2 = 0.07. D, Heatmap of normalized, relative gene expression comparing the indicated PDXs and organoids.

