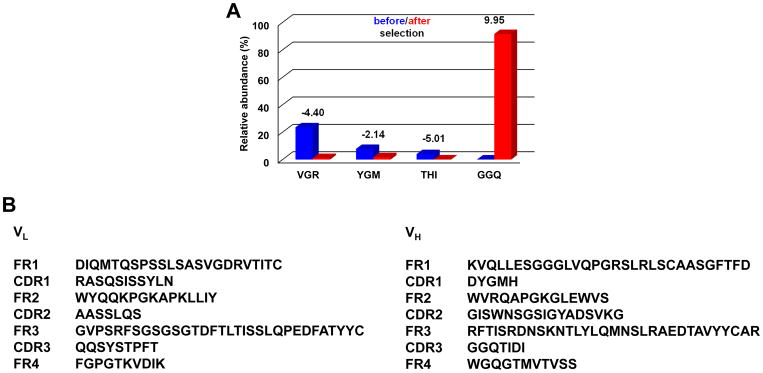
Figure 1. NGS analysis of alloHSCT Fab-phage library selection.
A, shown is the relative abundance of the three most frequent HCDR3 amino acid sequences before selection and the most frequent HCDR3 motif after selection of the alloHSCT Fab-phage library by three rounds of panning on CLL cells. VGR stands for VGRLQYDYYFDS; YGM stands for YGMDV; THI stands for THIVVVIPPGYFDL; GGQ stands for GGQTIDI (the HCDR3 of JML-1). Blue and red columns show the respective relative abundance before and after selection. The values on top of the paired columns give the log2 enrichment. B, amino-acid sequences of the variable light (VL) and heavy chain domains (VH) of selected post-alloHSCT Fab JML-1 (U.S. Patent 8,877,199). FR and CDR denote framework regions and complementarity-determining regions, respectively.

