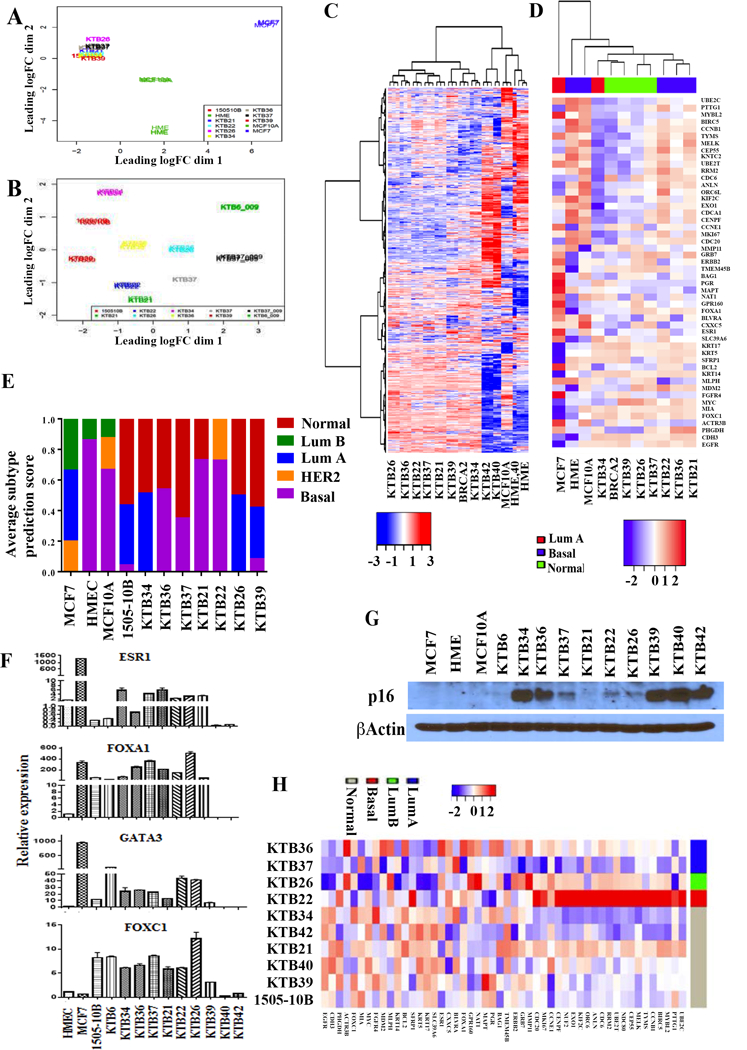
Figure 2: Classification of KTB cell lines based on PAM50 subtype predictor.

A) PCA analyses of RNA-seq data of all immortalized cell lines including HME, MCF10A and MCF7. 1505–10B is a BRCA2 mutant cell line. B) PCA analyses of RNA-seq data of KTB cell lines show heterogeneity in gene expression. C) Unsupervised clustering of RNA-seq data shows distinct gene expression pattern in KTB cell lines except KTB40 and KTB42 compared to MCF10A and HME. KTB40 and KTB42 clustered with HME and MCF10A. D) Classification of KTB cell lines based on PAM50 subtype classifier. E) Subtype prediction scores of individual cell lines. F) Expression levels of luminal-enriched ESR1, FOXA1, GATA3, and basal-enriched FOXC1 in different KTB cell lines. G) p16(INK4) expression in different cell lines. H) Classification of primary cells prior to immortalization based on PAM50 subtype classifier.
