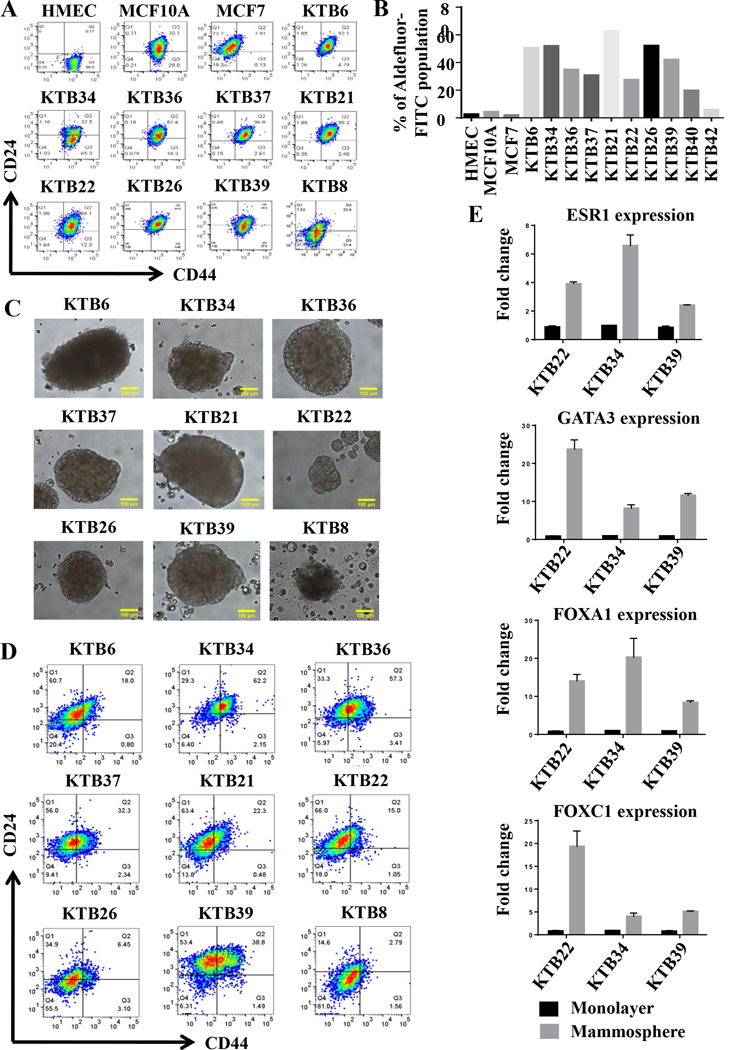
Figure 4: KTB cell lines show different levels of CD44+/CD24- and ALDEFLUOR+ stem cells based on culture condition.

A) CD44 and CD24 staining pattern of KTB cell lines. B) ALDEFLUOR+ stem cells in different cell lines. C) KTB cell lines form mammospheres of variable sizes. D) Cells in mammospheres show different levels of differentiation based on CD44/CD24 staining pattern. E) Cells in mammospheres show elevated levels of stem/basal (FOXC1) and luminal differentiation markers (ESR1, FOXA1, and GATA3).
