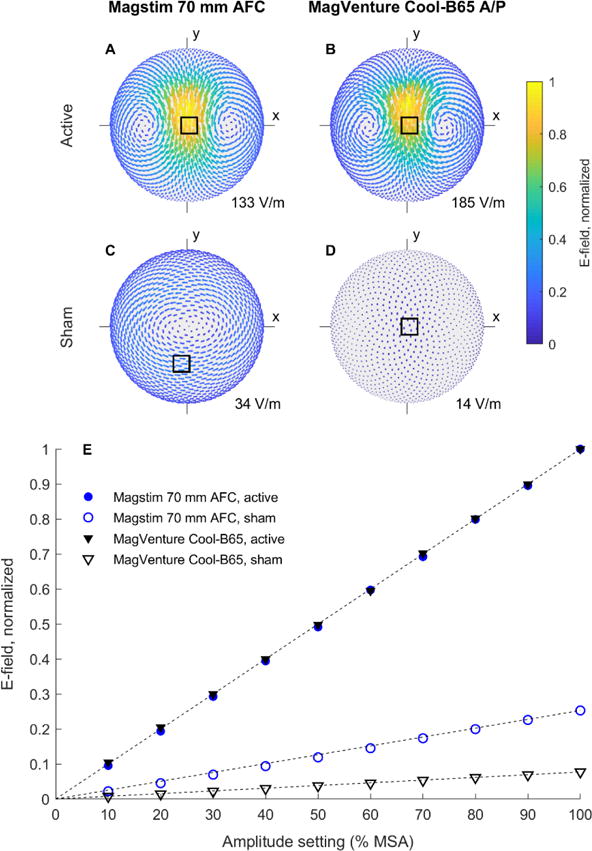
Figure 1.

A–D: Measured E-field distributions for the active and sham coil configurations. For each coil type, the distributions are normalized by the maximum E-field strength of the active configuration (supplementary figure S1 shows all distributions normalized by their own maximum). The location of each maximum is denoted by a square, and the absolute E-field strength at this point for 100% maximum stimulator amplitude (MSA) is noted in the lower right corner of the plots. E: Measured peak E-field strength as a function of stimulator amplitude setting. Normalization is the same as in A–D. A dashed line is drawn from the origin to the normalized value at 100% MSA for each coil.
