
Figure 5. Tumor-Mapping of Surgical Specimens.
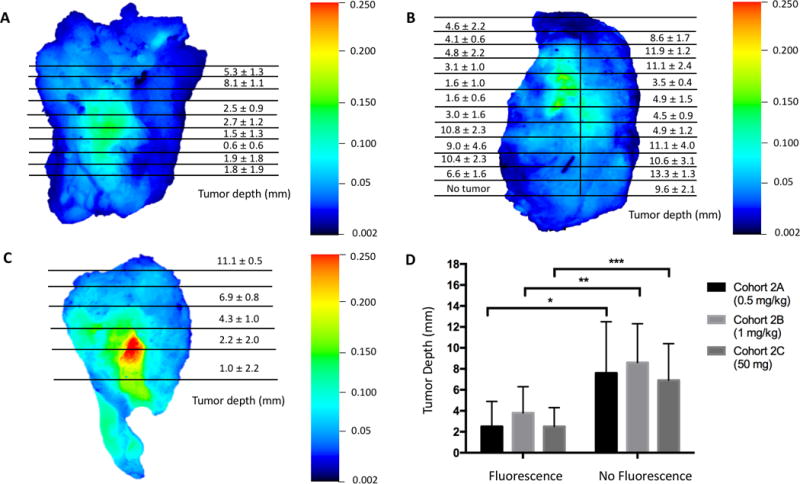
Distance of tumor tissue to the deep margin surface of the primary tumor specimen given as average tumor depth (mm) ± standard deviation. Views of the entire deep margin surface of representative samples from cohort 2A (A), cohort 2B (B), and cohort 3 (C) are shown here. Comparison of tumor tissue depth from the deep margin surface of the primary tumor specimen in fluorescent areas versus areas without fluorescence (D).