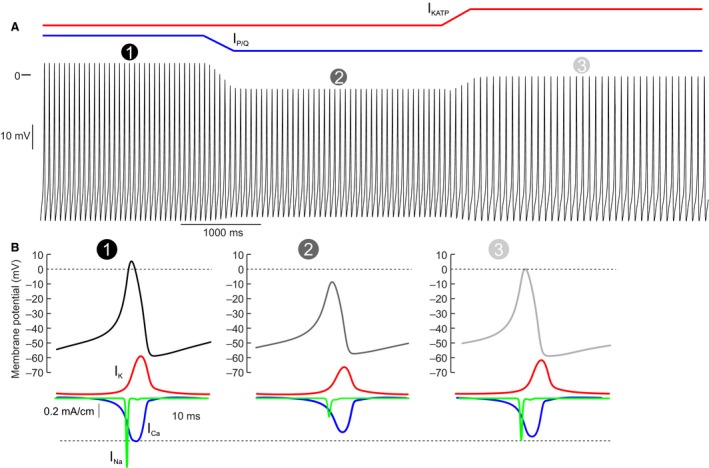
Figure 9.

Mathematical model of P/Q‐type Ca2+ inhibition in human α‐cells. (A) Mathematical model of membrane potential in a human α‐cell. The model was simulated under low glucose conditions  . The P/Q‐type Ca2+ current was then reduced
  , mimicking GLP‐1 application (Fig. 7B). The KATP current was then increased
  , to mimic the action of diazoxide (Fig. 6). (B) The influence of the different simulation conditions on action potential height. P/Q‐type inhibition reduces action potential height
  , and this is restored by increasing the KATP current
  . The below traces show the transmembrane K+ (red), Na+ (green), and Ca2+ (blue) currents (IK, IN
a and IC
a, respectively) underlying the action potential. These simulation data explain why diazoxide can restore glucagon secretion in the presence of GLP‐1.
