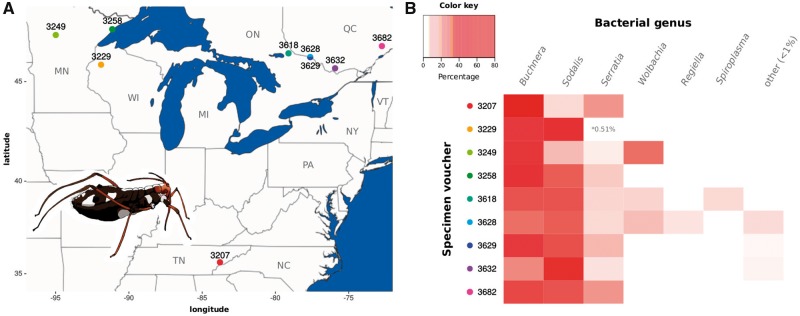
Fig. 1.
—Distribution of sampled C. strobi populations and 16S rRNA high-throughput bacterial symbiont screening. (A) Map showing the north-east USA and south-east Canada regions where the C. strobi samples were collected (coloured points) featuring a cartoon of a C. strobi apterous female adult. (B) Heat map displaying the relative abundance of Illumina reads per taxon per sample. On the top-left, color key for the taxon abundance. On the left, voucher ID for the sampled C. strobi populations with colored dots matching the map in (A).

